Add support for W3C Trace Context propagation on outgoing HTTP requests. Enable via config.http.distributedTracing (boolean, or object with enabled, sampled, and traceIdPrefix fields). When enabled, Artillery adds a traceparent header to each request so backend traces can be correlated with the originating test.
AWS Fargate
Add CLI heartbeat mechanism for scenarios where the CLI exits abnormally (e.g. with SIGKILL) and worker tasks continue running. Fargate worker tasks will now self-terminate if the CLI disappears for more than 180 seconds.
Slack plugin
Add notifyOnFailureOnly option to only send a Slack notification when a test fails.
Playwright
Upgrade to Playwright v1.59.1
Fixes & improvements
AWS Lambda
Fix issue where test data with npm dependencies (for example, TypeScript scenarios that require external packages) could silently skip installation, causing the test to fail later with module-not-found errors.
Core
Upgrade the HTTP engine to Got v14.6.6 (from Got v11). Potentially breaking change if your tests use hooks that access or modify Got internals.
Azure ACI
Test artifacts in Blob Storage are now retained by default. To automatically remove old artifacts, configure a lifecycle management policy on the storage account.
OpenTelemetry
Upgrade the OpenTelemetry JS SDK to 2.x. Artillery now emits both the legacy and current semantic attribute names on spans (for example http.url alongside url.full, and http.method alongside http.request.method) so existing dashboards and queries continue to work.
Other improvements & fixes
Worker images used on AWS Fargate, Lambda and Azure ACI are now based on the official Docker Hardened Node.js image
Fix: ensure that when running tests on Fargate, the pre-packaged versions of Playwright / Artillery CLI are always used, and not reinstalled as dependencies. This fixes Playwright browser binary mismatch errors under some conditions.
Add query string normalization to reduce the number of distinct metrics in Playwright tests. Two new configuration options are now available:
stripQueryString (defaults to false): Remove query strings from URLs
normalizeQueryString (defaults to true): Normalize query string values to reduce metric cardinality. Converts numeric values like /page?id=123 to /page?id=NUMBER
Fixes & improvements
Fix issue on Azure ACI where tests that track many distinct metrics could fail or report incomplete results
Fix issue on AWS Fargate where --scenario-name flag was ignored, causing all scenarios to run instead of just the specified scenario
We have significantly improved the performance of load test reports for tests with many distinct metrics: memory consumption was reduced, Text logs and Activity widgets open much faster, and the Chart builder widget can now handle thousands of metrics.
Chart tooltip sync
Tooltips are now synchronized across visible charts making it easier to compare metrics. We also improved the tooltip design and tweaked chart legends to take less space on the page, further improving the readability of reports.
Export as PDF
We have added a new option under the test view more menu (…) so you can now export test reports as PDF.
Misc
Add search functionality to Text log widget
Add loading state to Metrics page
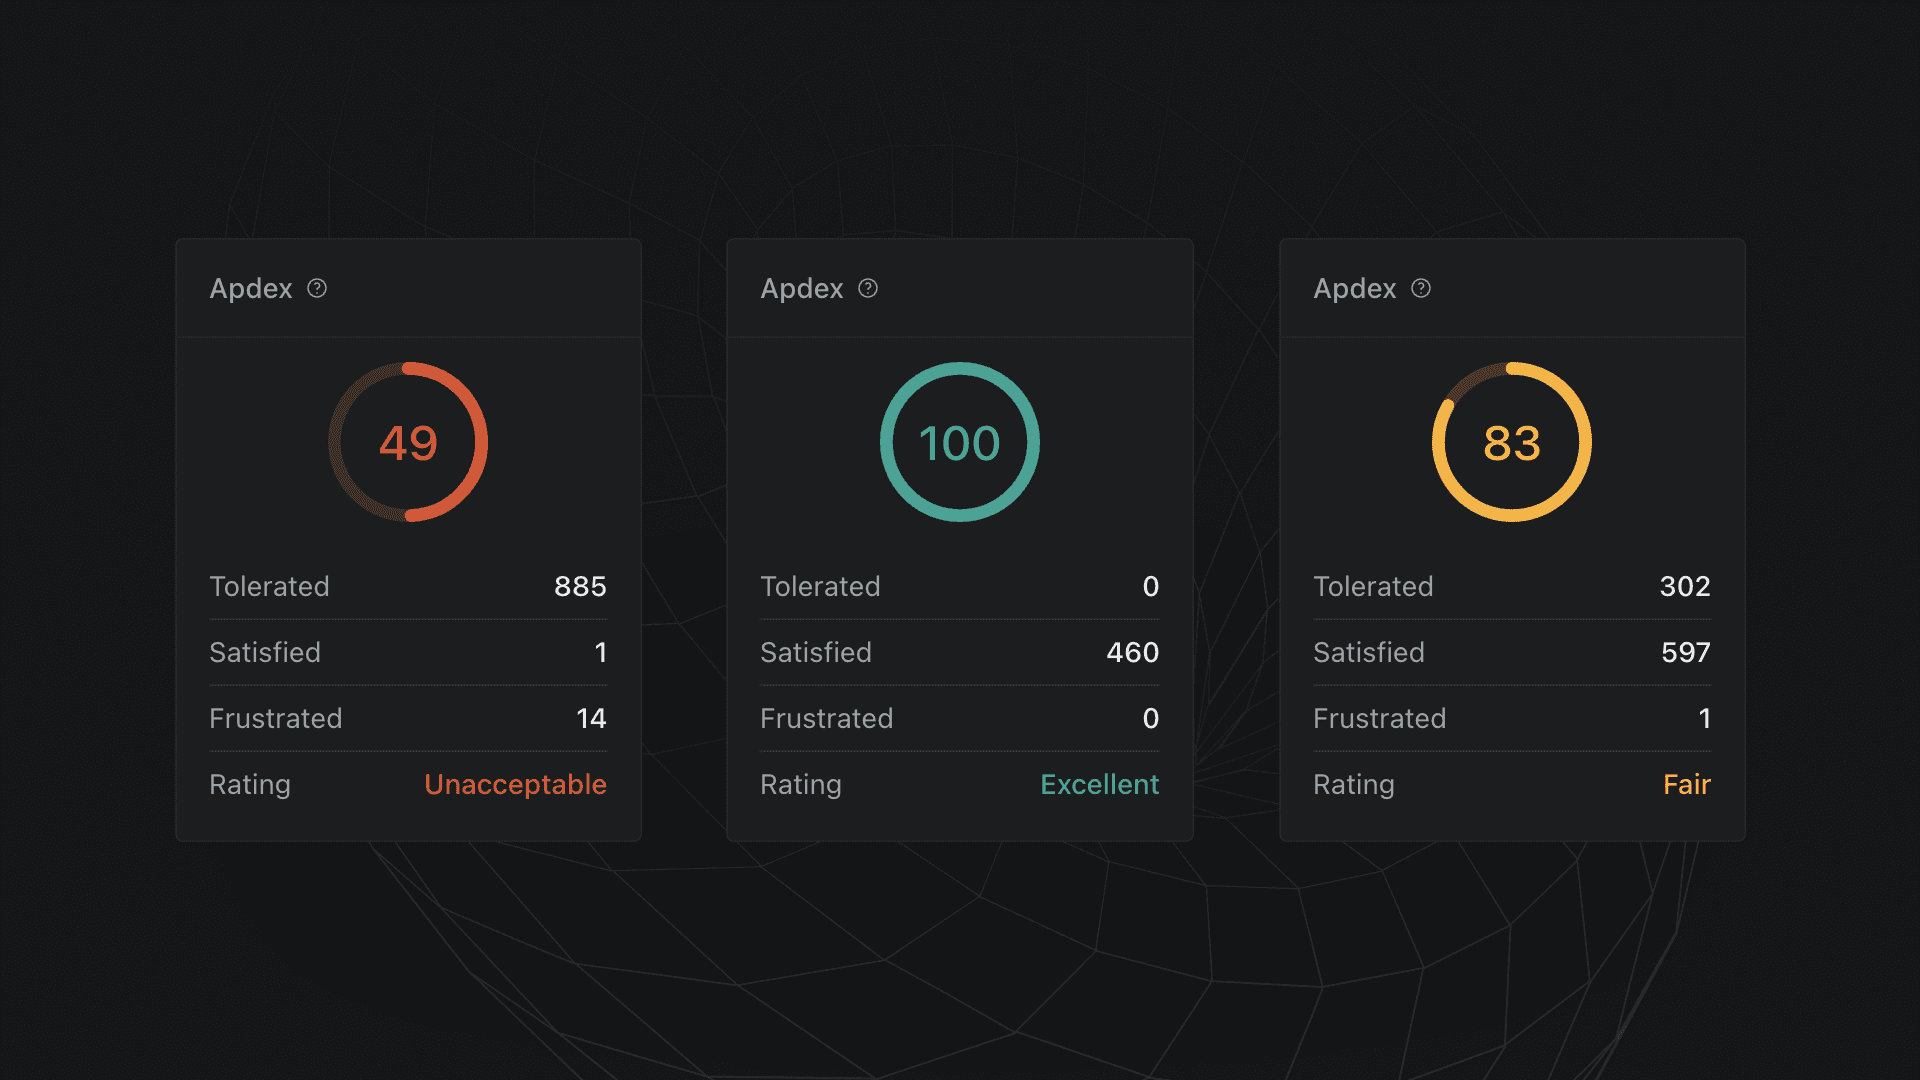
Add missing empty state to Apdex widget
Fix chart navigator not showing reliably across different charts
Fix charts having incorrect zoom level on page load
Fix some dates not showing correctly when using UTC
Custom metric names are now limited to 1024 characters
AWS ECS/Fargate
Add new --no-assign-public-ip flag to disable automatic assignment of public IPs to worker tasks. This allows for load tests to run from private subnets with a NAT gateway attached for use-cases where traffic has to come from a set of known IPs.
Azure ACI
Azure load testing is now available on all subscriptions, including month-to-month ones. Previously only annual subscriptions could use the Azure integration.
Load testing with Playwright
Upgrade to Playwright v1.56.1
FID (First Input Delay) scores are no longer reported. FID has been deprecated as a Core Web Vital metric on September 9, 2024, and replaced by INP (Interaction To Next Paint). https://web.dev/articles/fid
Fixes & improvements
AWS ECS/Fargate
Fix issue where ECS IAM policy could not be created.
Fix handling of relative paths in config.payload when a separate config is used with the --config flag.
Stash API is now available. Stash API provides a persistent key-value store for use in your Artillery tests to share data between VUs, and offers Redis-compatible features like working with key-value pairs, lists, counters, and more. Learn more in the Stash API docs
Playwright
Upgrade to Playwright v1.55.0
Fixes & Improvements
Fix: Prioritize dependencies set via package.json over automatically-detected dependencies. This fixes issues where latest versions of dependencies could be installed rather than those specified in package.json
Fix: Avoid promisifying async “function” steps. This removes Node.js warnings when when an async function is used for a function step
Fix: Use China partition-aware ARNs and principals for tests on AWS Lambda/Fargate
Routine updates to dependencies to address security reports
Remove dependency on PostHog SDK
Migrate to AWS SDK v3. This is an internal change that does not affect any user-visible functionality
Playwright v1.51.0 and later automatically attaches a prompt with useful context for every failing test case. You can copy that prompt with the “Copy prompt” button in the report and in the trace viewer.
This feature requires Playwright v1.52 or later.
captureGitInfo support
The report will show the details of the Git commit if captureGitInfo: { commit: true } is enabled in your playwright.config.ts file (see Playwright docs for details).
Increase maxConcurrentRecordings from 3 to 5 to increase the probability of capturing traces for failed VUs (#3533 )
Increase upload timeout for traces to help make sure large trace recordings are uploaded to Artillery Cloud (#3533 )
Azure ACI
Client ID and client secret must be provided via AZURE_CLIENT_ID and AZURE_CLIENT_SECRET environment variables rather than CLI flags. This brings Artillery CLI in line with Azure SDK’s DefaultAzureCredential credential chain. (#3525 )
Add support for overriding worker startup timeout via WORKER_WAIT_TIMEOUT_SEC environment variable (#3527 )
Fix issue that caused tests comprised of a single TypeScript file to fail to run (#3528 )
The report command has ben removed. As an alternative consider setting up Artillery Cloud for visualizing test metrics, or setting up an OpenTelemetry integration with an external monitoring system with the publish-metrics plugin. (#3431 )
Node.js v22.13.0 (current active LTS) is the recommended version of Node.js for running Artillery now
Add --env-file flag as an alternative for --dotenv flag. This makes it consistent with the Node.js --env-file flag. The --dotenv flag will be deprecated in a future release (#3376 )
Add tracking of response times by HTTP status code. A new set of metrics (e.g. http.response_time.2xx or http.response_time.5xx) is now reported to provide more granular view of response times in a test (#3326 )
Fix an issue that caused incorrect “multiple batches of metics” warnings when running tests with pause phases (#3331 )
Playwright
Upgrade Playwright to v1.48.0
Azure
Fix: Make values loaded from an env file with --dotenv / --env-file flag available to workers containers (rather than just the Artillery process running inside the worker) (#3376 )
Stagger startup of containers in large load tests to prevent rate limit errors from Azure services (#3371 )
OpenTelemetry
Add support for setting resource-level attributes (#3335 )
Artillery Cloud
Send CI related information to Artillery Cloud. This makes the following information available in Artillery Cloud:
Whether a test run was triggered in CI or not, and which CI service was used
For tests triggered in GitHub Actions - provide a link back to the job run on GitHub Actions
Dependencies
Upgrade json-plus to address a critical security vulnerability (#3369 )
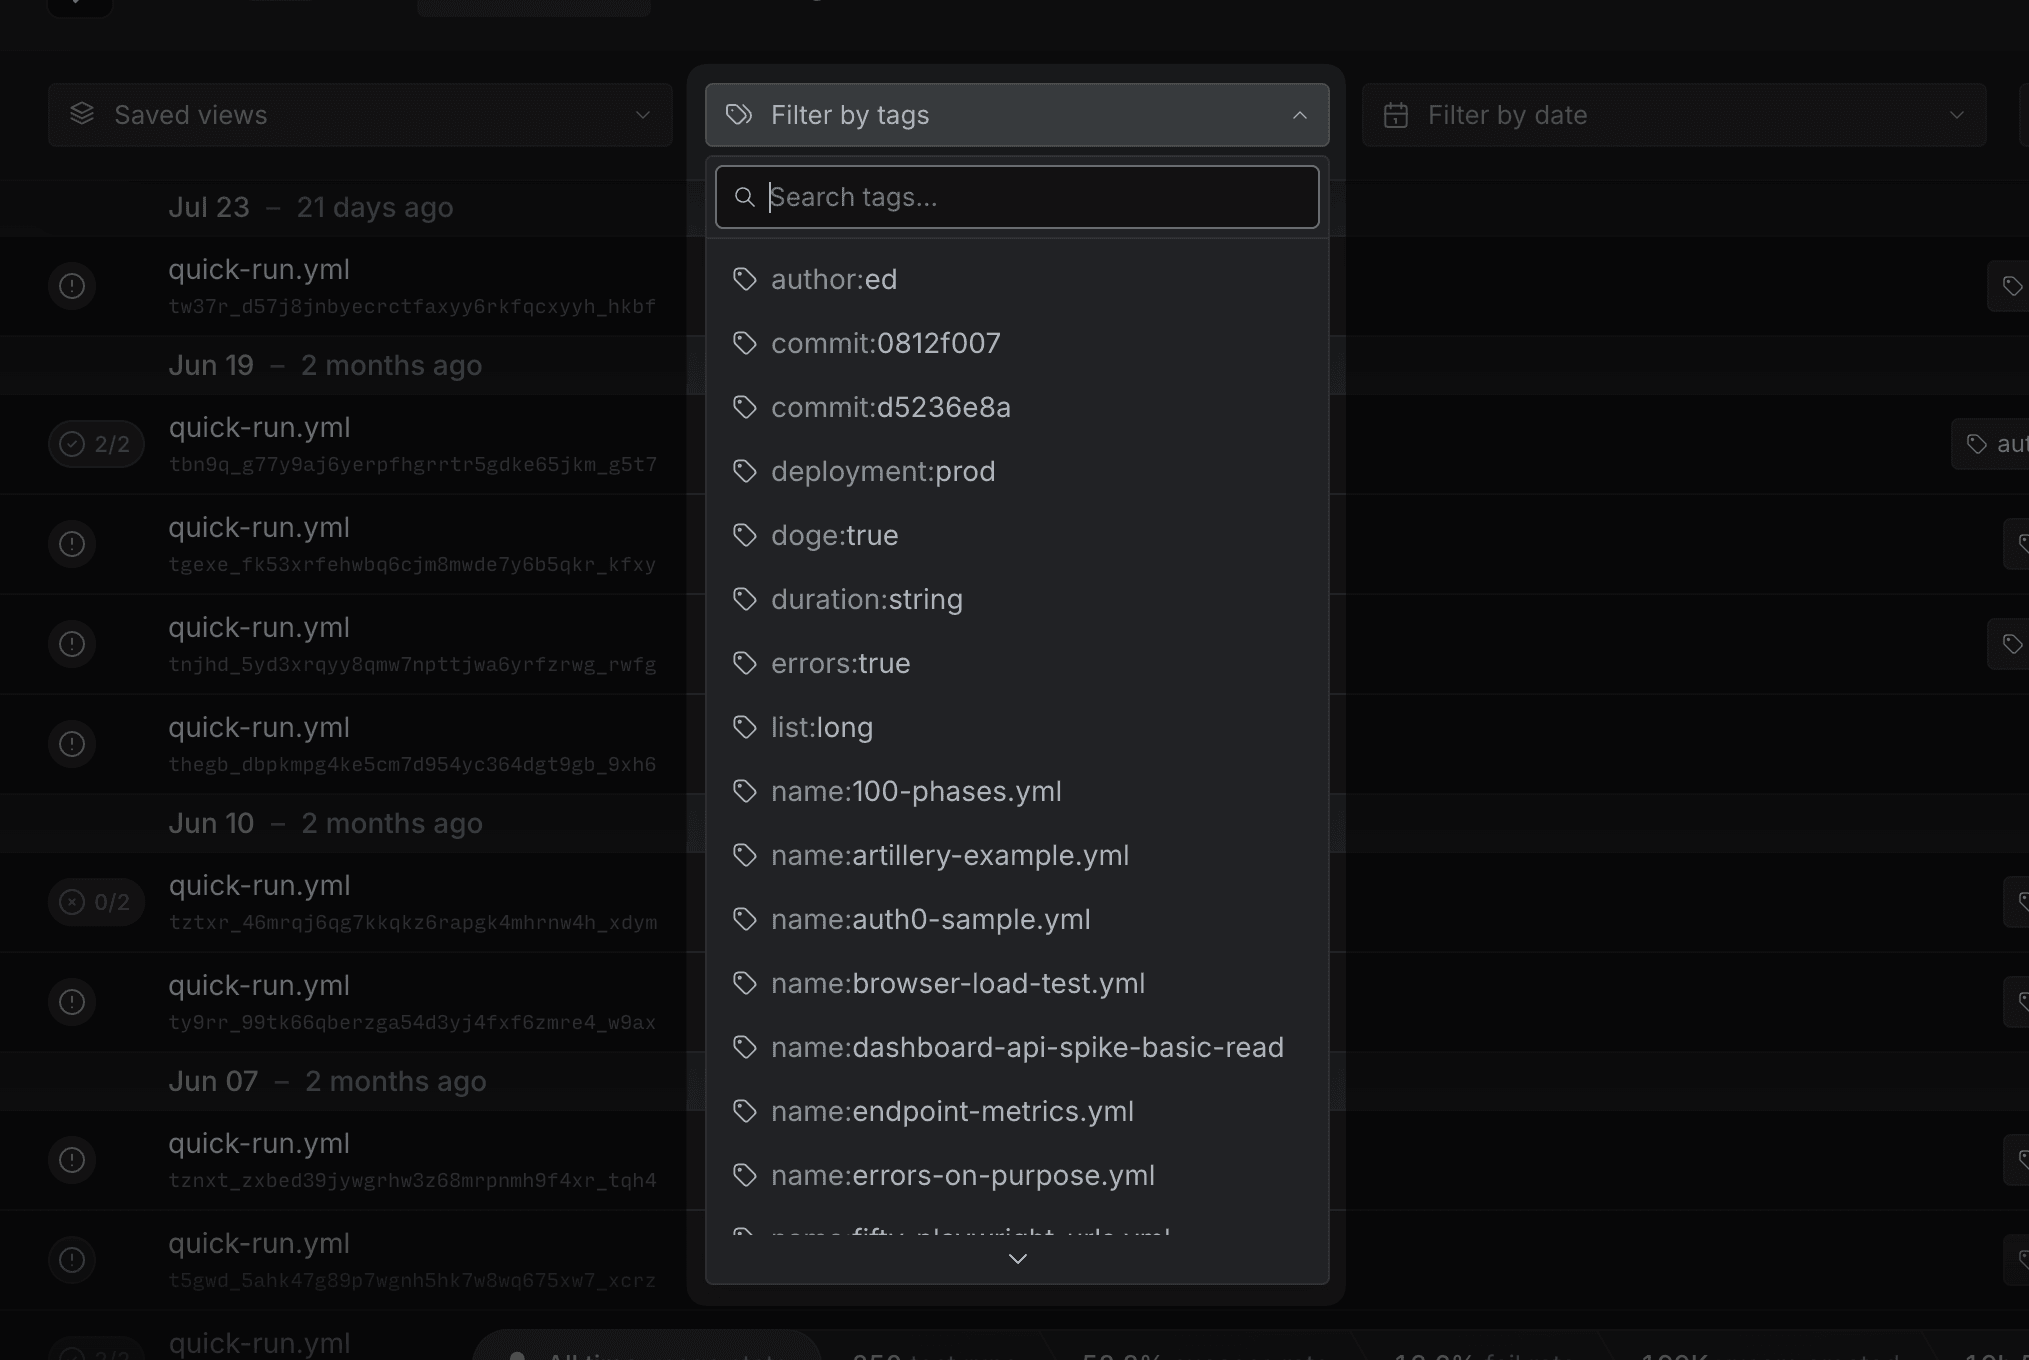
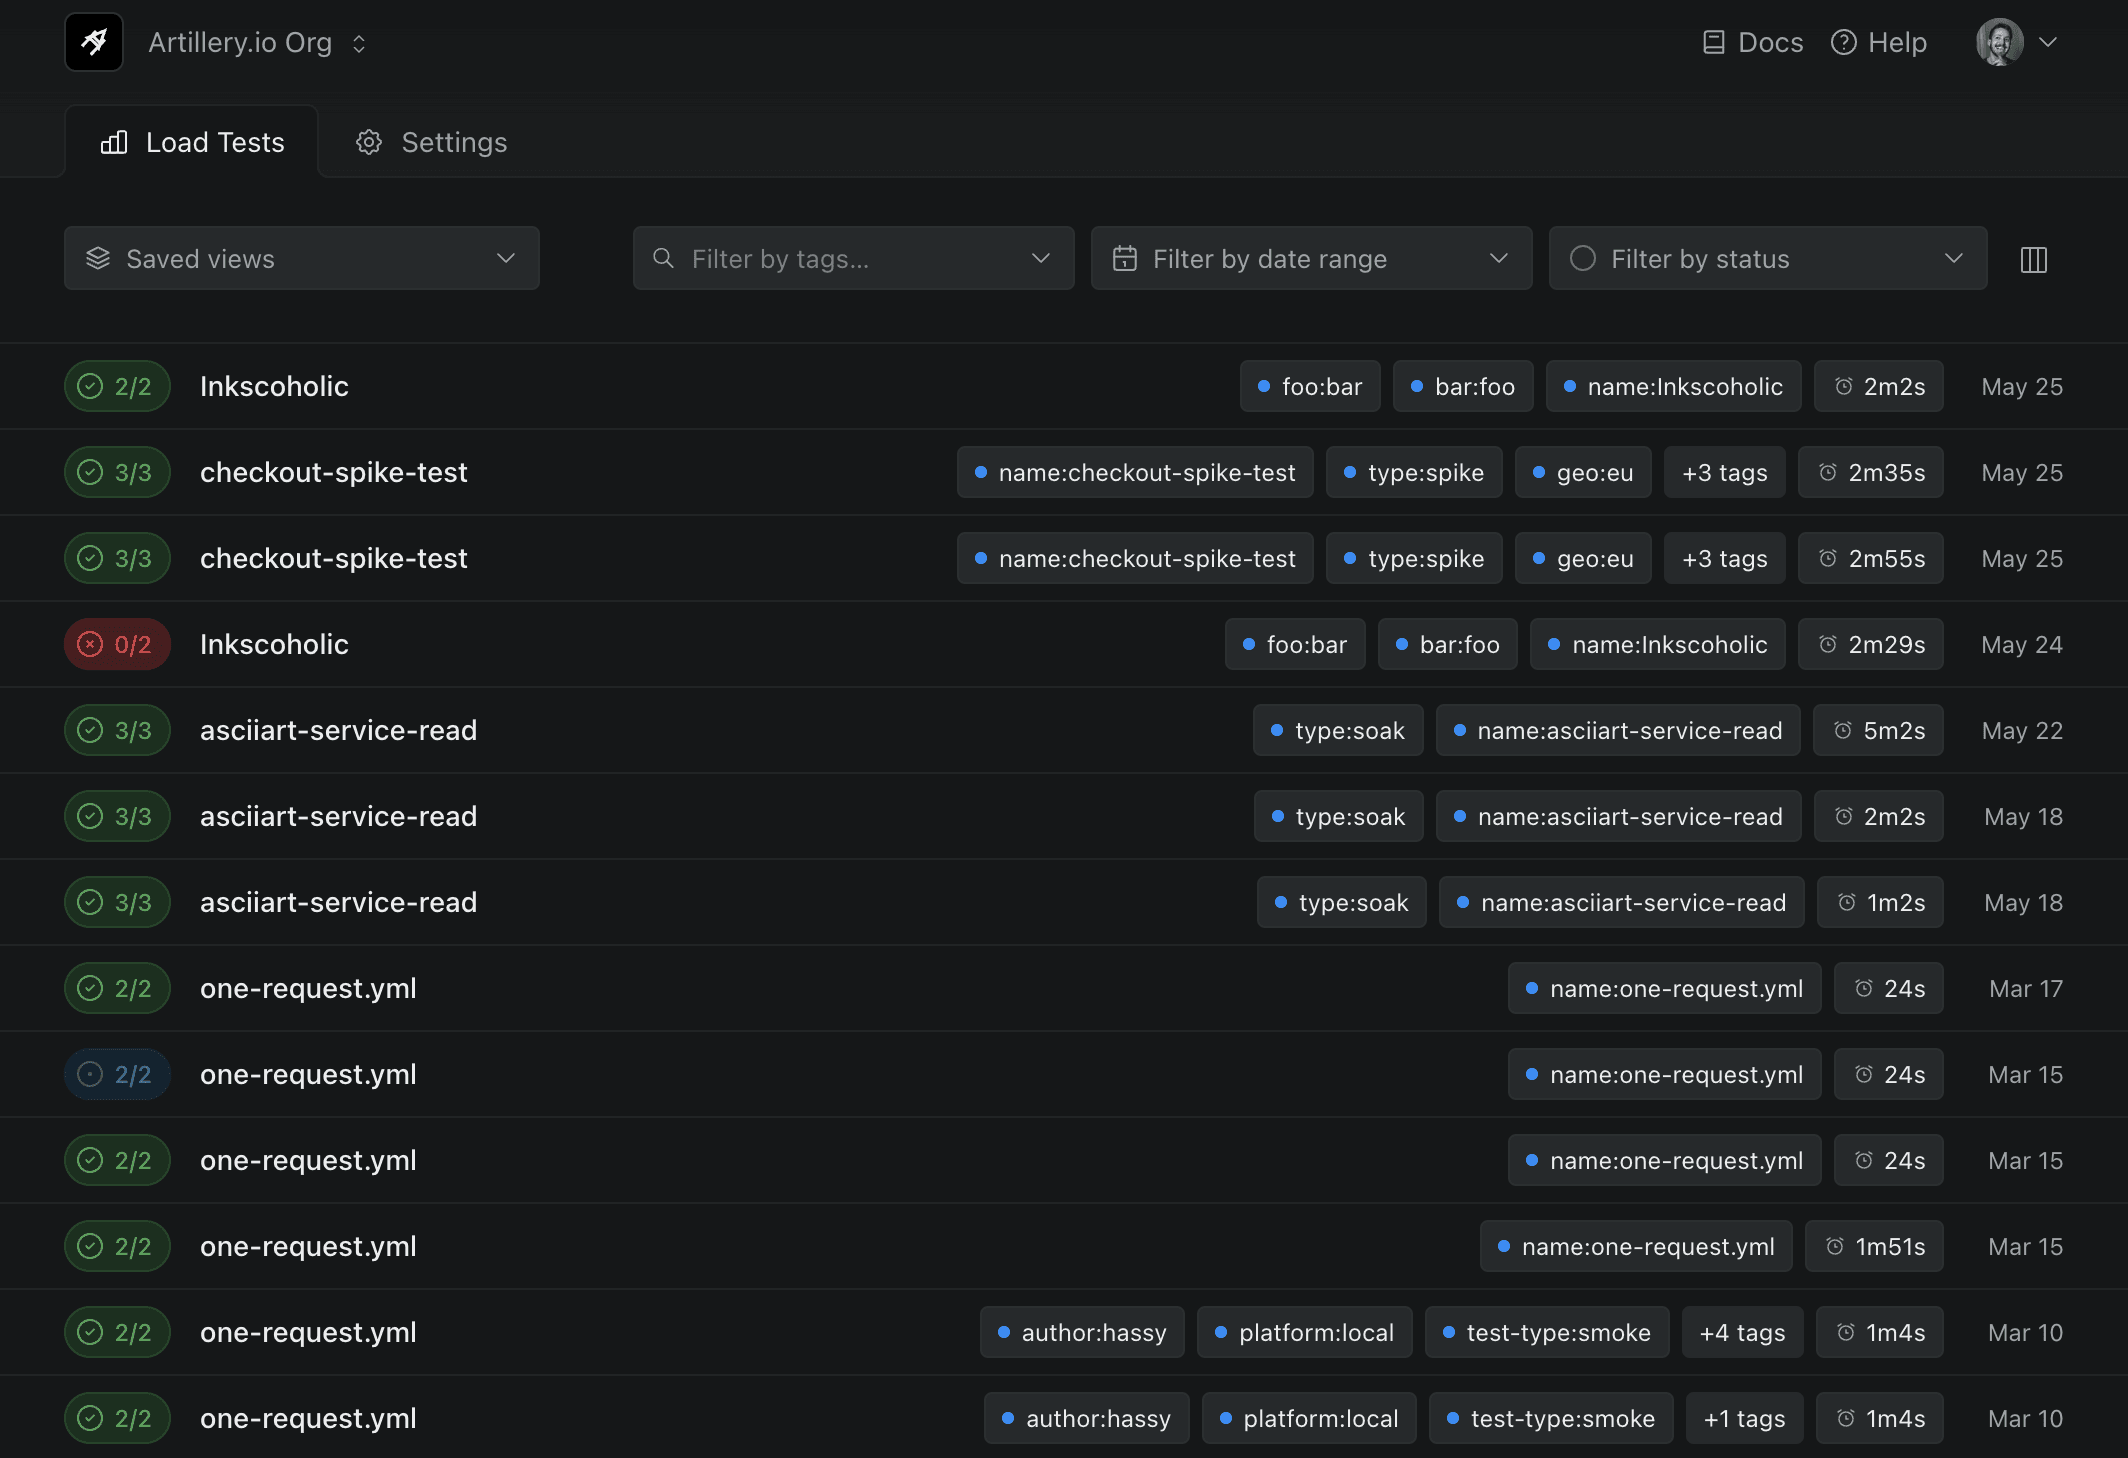
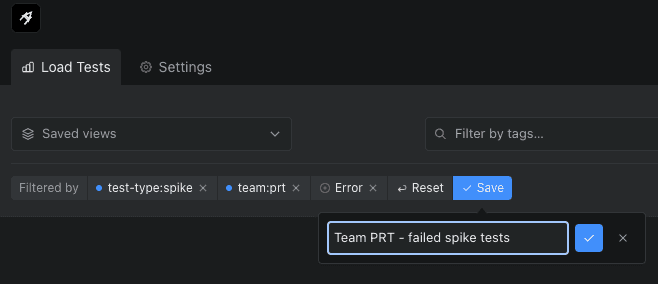
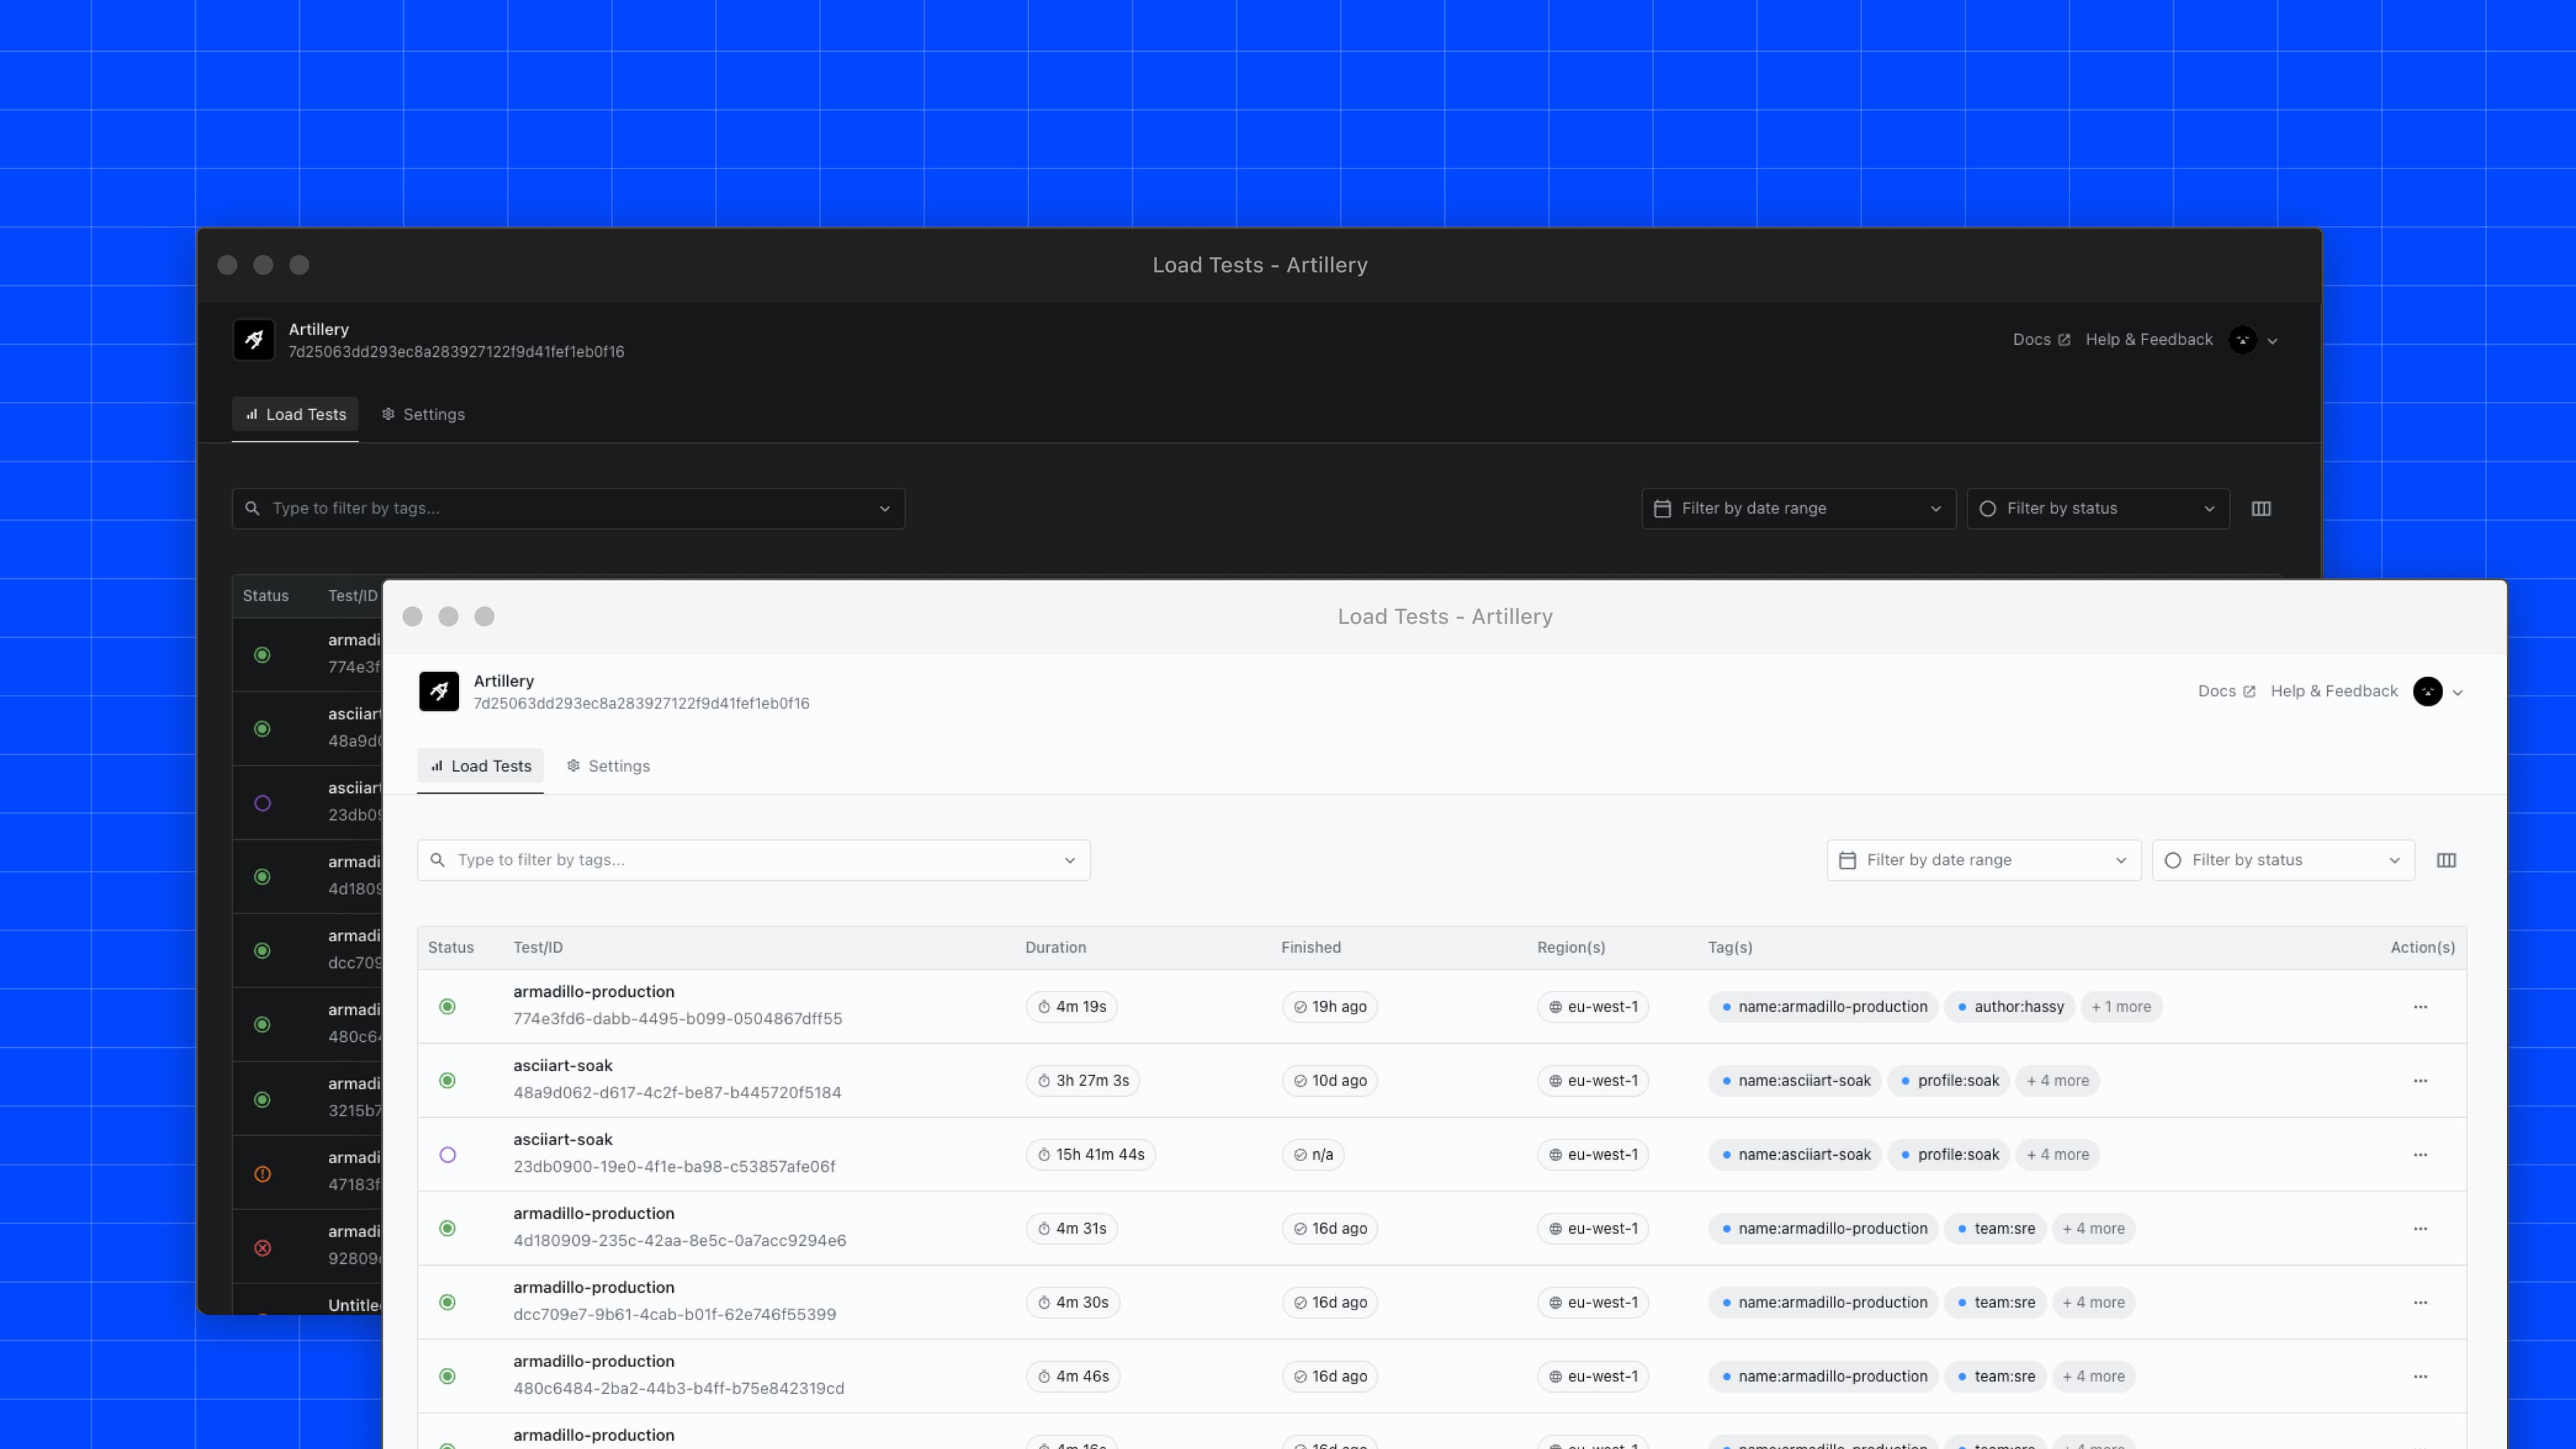
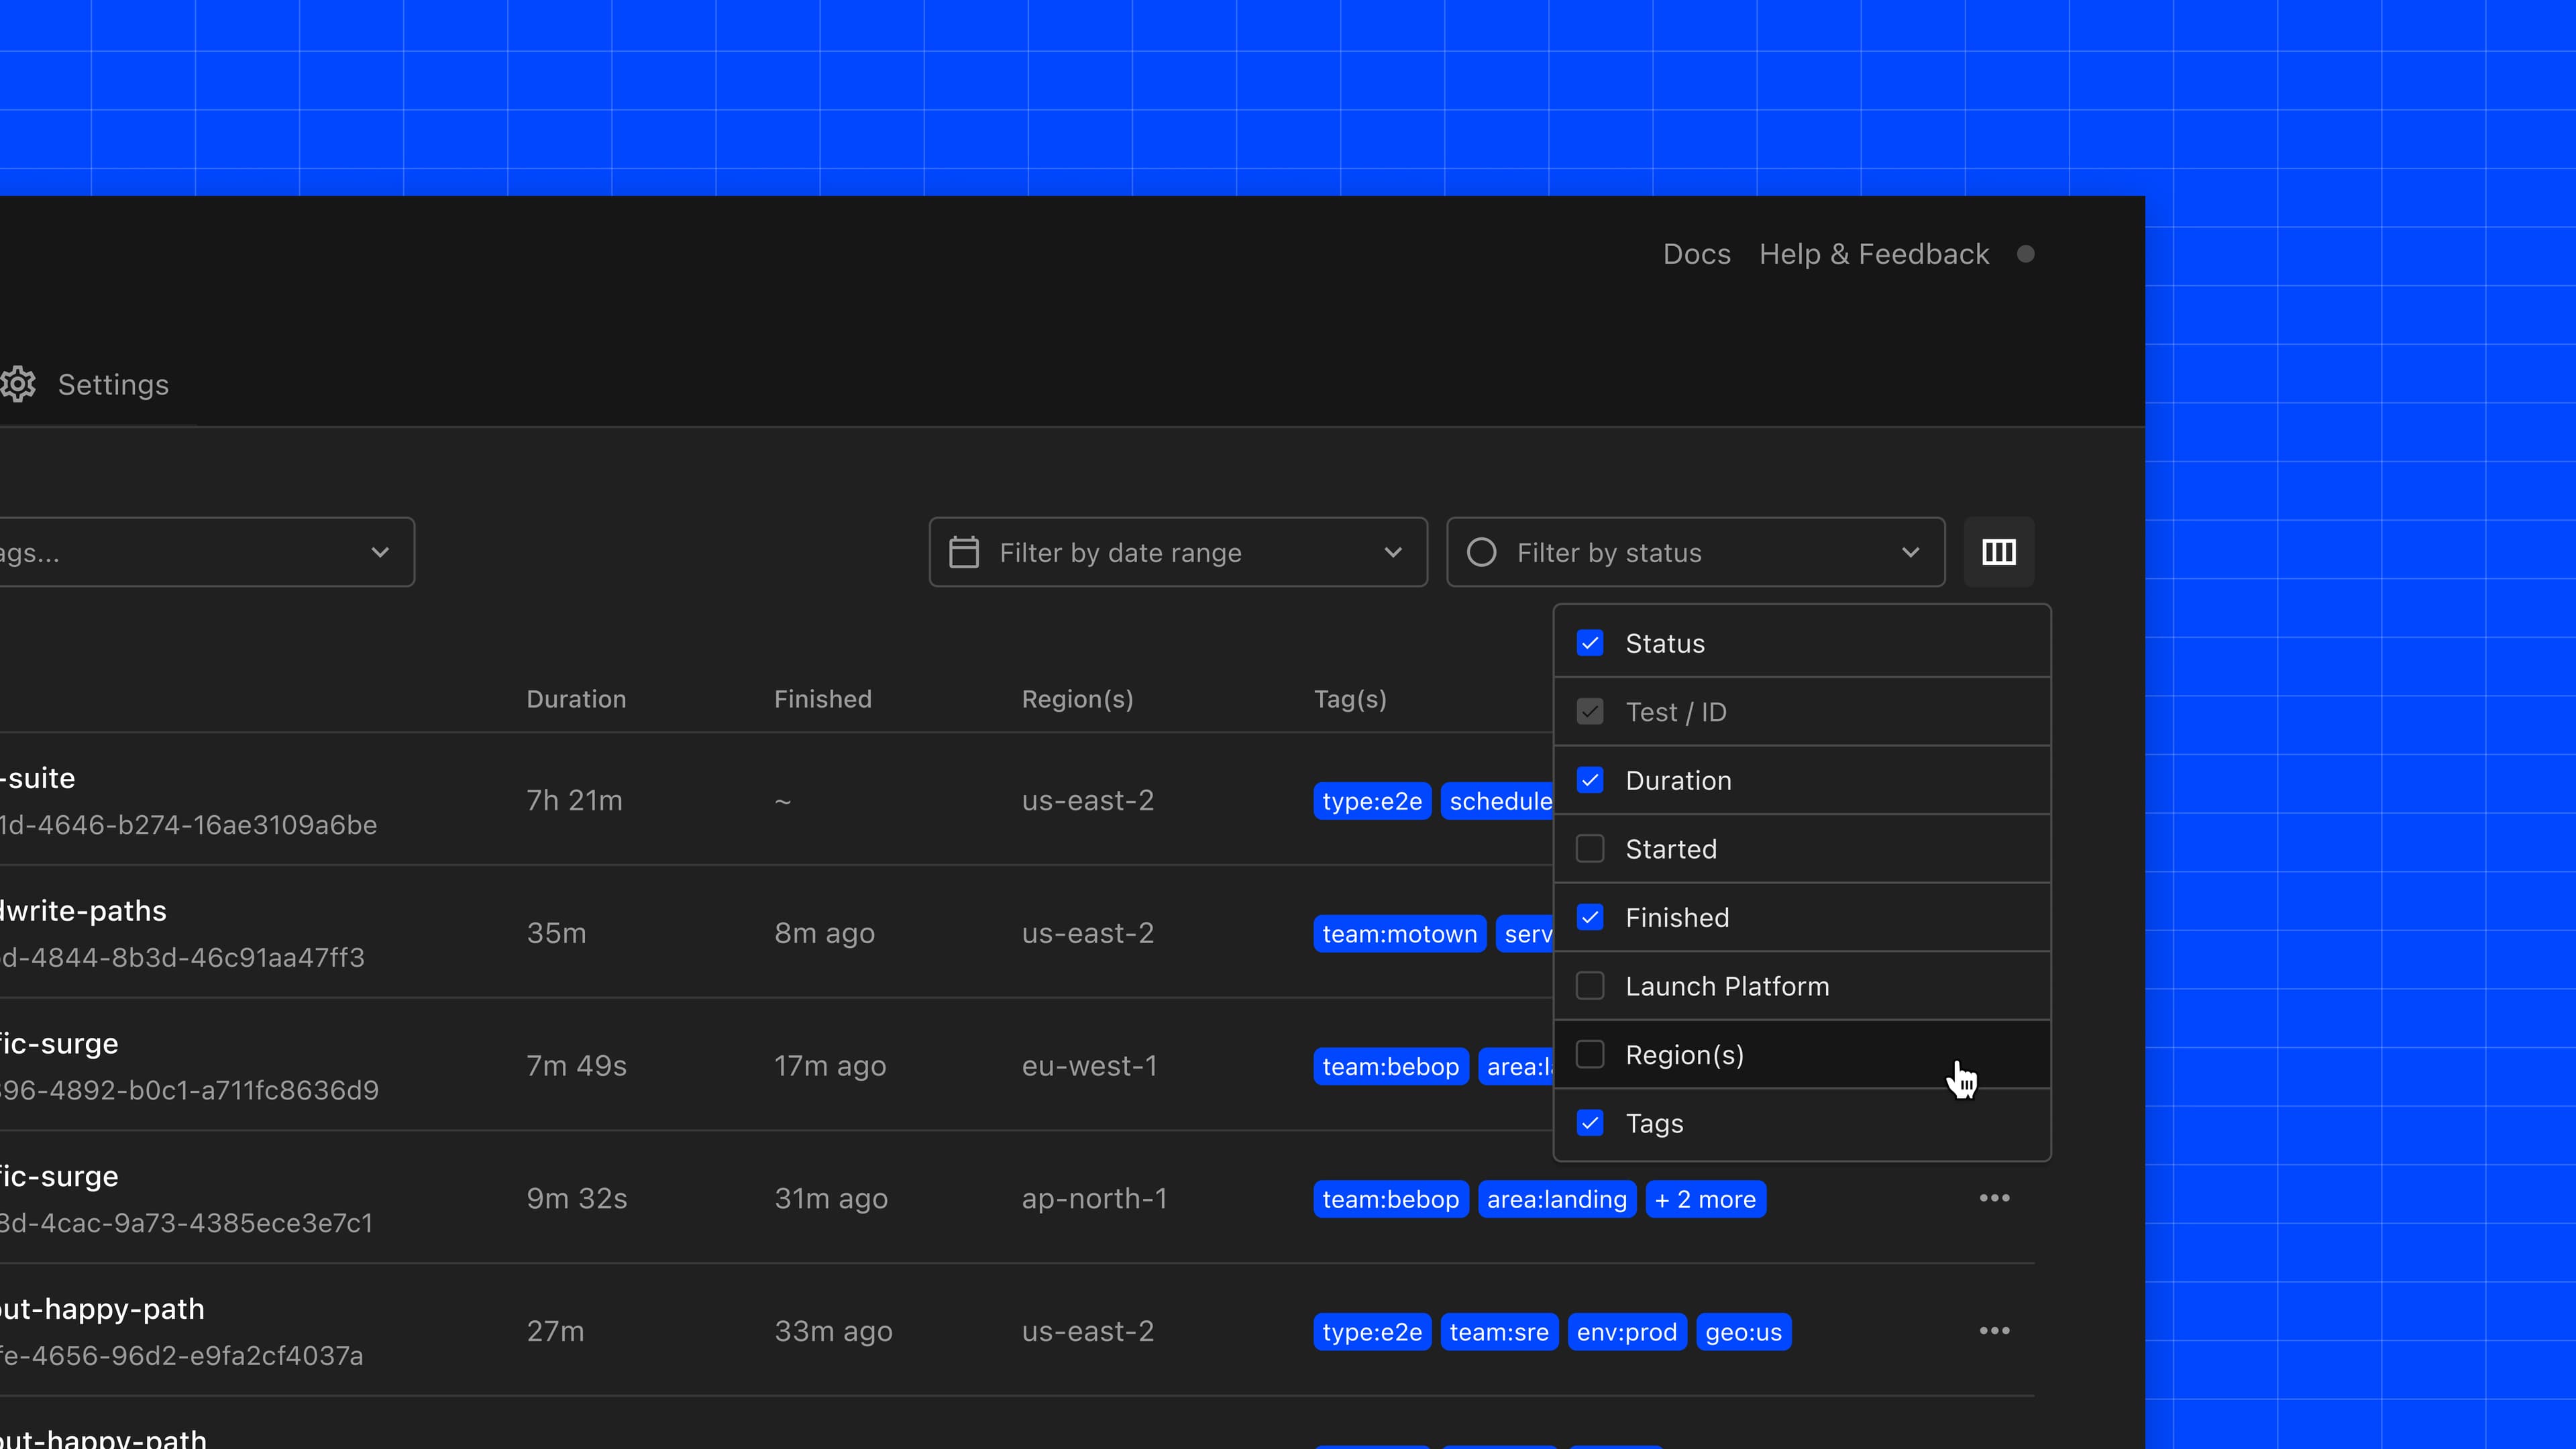
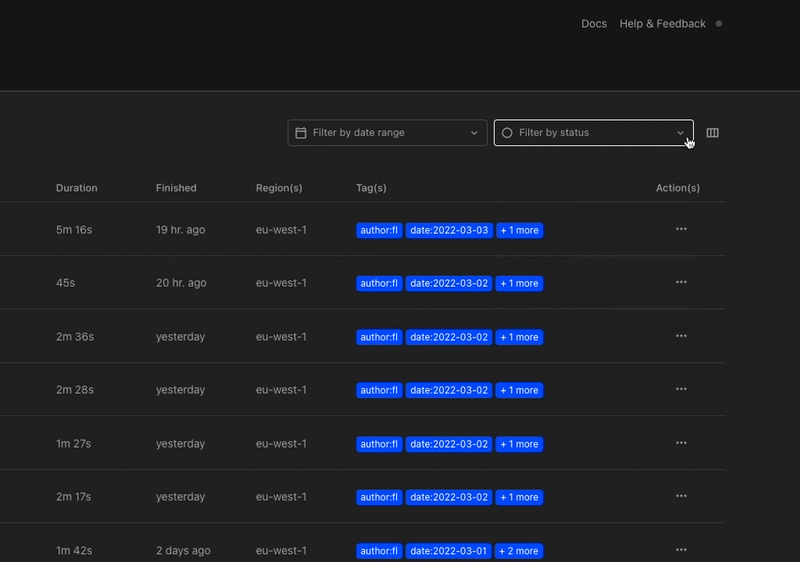
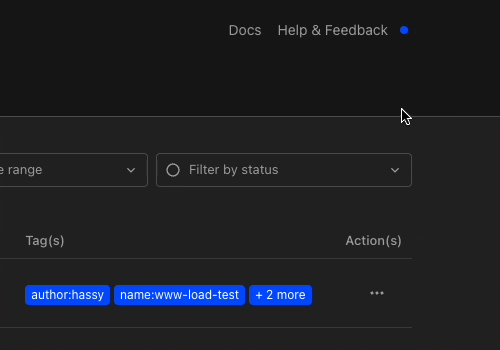
Introducing a new way to filter and organize your tests. We have updated the UI to better surface all filters and added even more options to filter by, so it should be easy to find specific test runs.
New filters: test name, platform, user, tests with notes, and shared tests
UI is now fully keyboard accessible
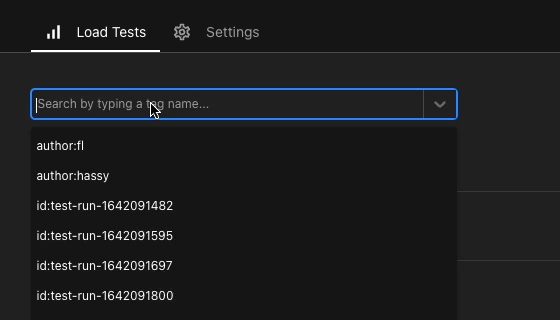
Improve search functionality for test names and tags
Filters can be saved as Views for easy access and faster team collaboration
Comparison view improvements
Added new filters to Comparison view so you can quickly find tests to compare
Compare tests that have different names
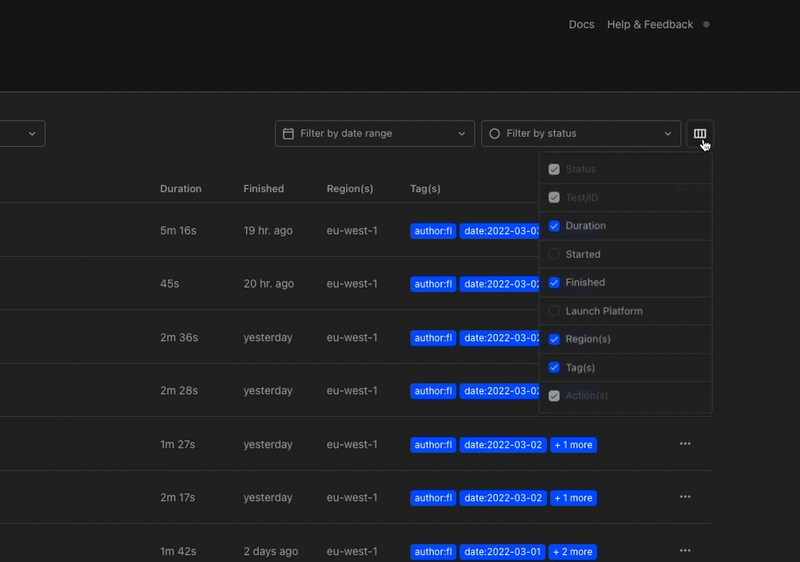
Toggle what properties are displayed on the test list with the Display dropdown
Use Views to quickly get back to previous saved filters
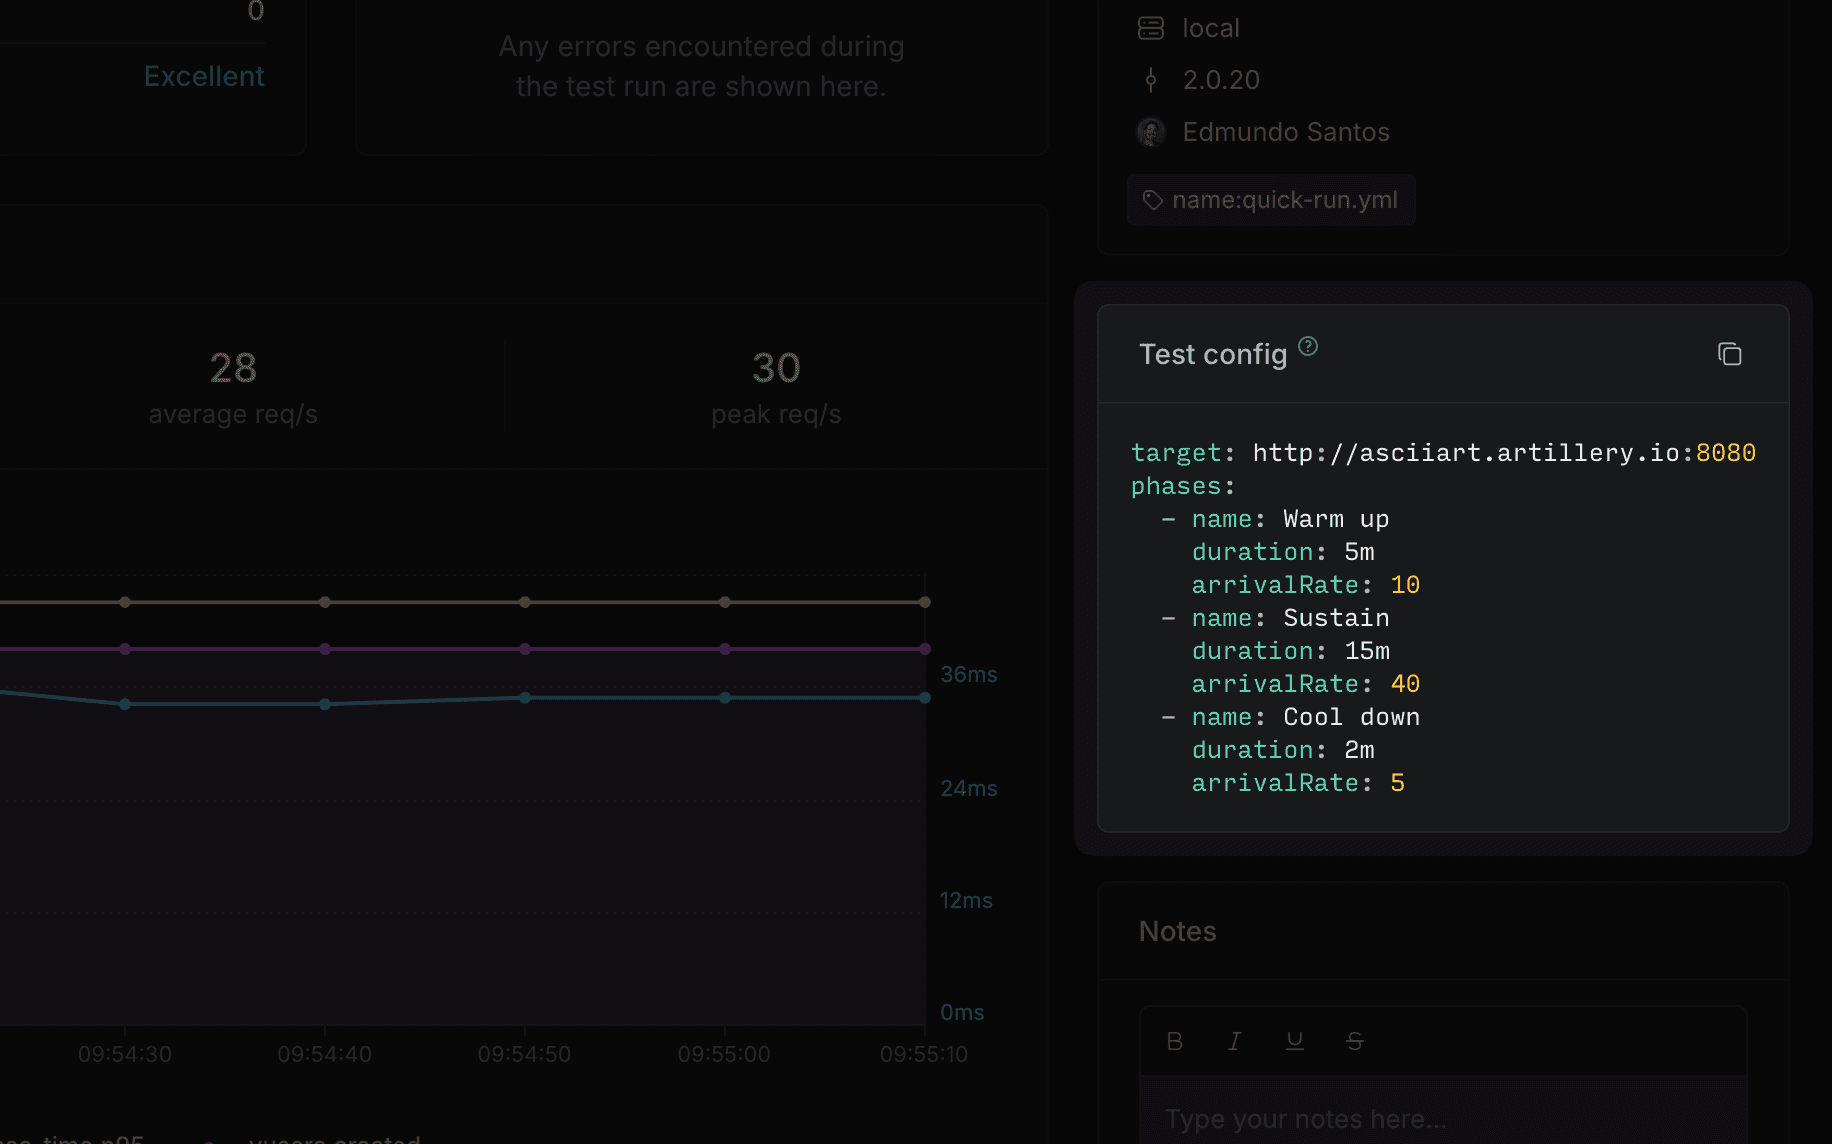
Test config
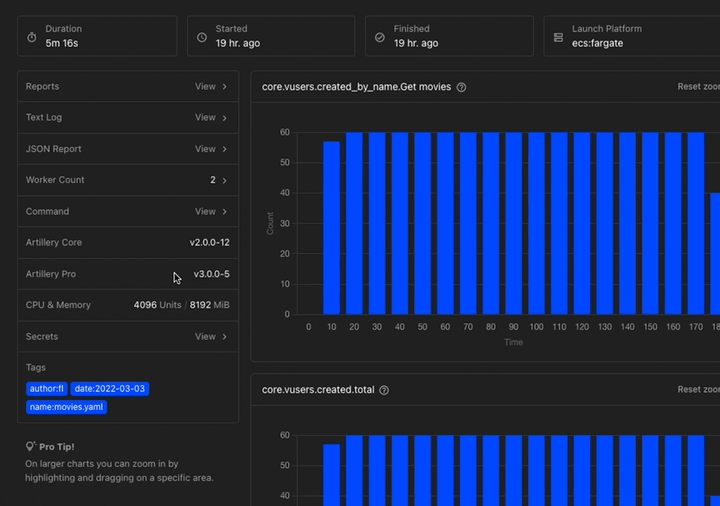
You can now see the target and phases of your test right from the load test view — added in Artillery CLI v2.0.20.
You can now try our new Comparison view. This feature lets you to compare two test runs side by side, making it easier to spot trends and correlations between them. Right now the feature is in open preview for all Artillery Cloud users, so try it out and let us know what you think.
Bugs fixes & improvements
Improve performance when creating custom charts and adding notes
Add pagination to HTTP and Page performance widgets if more than 10 results are available
Fix a bug with the tooltip on HTTP requests chart would not display correctly
Improve performance for Chart builder widget and Metrics page navigation for tests with many metrics
Improve Notes widget responsiveness on smaller screens
Artillery will now always use Lambda Container Images to run tests on AWS Lambda. The --container flag introduced in v2.0.12 is no longer required and will be removed in the next release. Creating Lambda functions from .zip archives is no longer supported.
All existing tests should continue running normally without needing any changes. If you run into any issues please open an issue .
This change brings improved startup times for tests running on AWS Lambda and brings AWS Lambda support to parity with AWS Fargate.
Fixes
Increase startup timeout time for Lambdas running in a VPC
Exit with non-zero code if a Lambda worker fails
Fix issue that could lead tests to crash when triggered from a Windows machine
Expose current worker ID to Lambda workers as WORKED_ID environment variable
Playwright
Accept 0 values for defaultNavigationTimeout and defaultTimeout settings
A warning will be printed if a Playwright testFunction cannot be found
Artillery can now use Lambda Container Images to run tests on AWS Lambda. Pass the --container flag to run-lambda command to use a container instead of a zip file. No further configuration is required.
This change brings two main benefits:
Much faster startup times for tests
Ability to use certain features that were previously only available in tests running on AWS Fargate:
Run test scripts that TypeScript hooks
Use third-party dependencies
Use the built-in publish-metrics plugin
Container-based Lambda functions will become the default option in a future release of Artillery.
Playwright
Update Playwright to v1.44.0
Fix tests failing on Fargate with ENOSPC error with Playwright tracing enabled
Improve reliability of trace collection:
Reduce trace collection cooldown period to 1-5m
Increase the number of concurrent trace recordings to 3 up from 1
Track the number of collected/discarded recordings with browser.traces_collected and browser.traces_discarded metrics
CLI & Core
Make path to the config directory available to test scripts via the special $dirname variable - docs
The --scenario-name flag will now default to using an exact string match, and fall back to using a regex
Clarify the meaning of --tags flag
Remove an unnecessary dependency
Slack integration
Artillery now includes an official Slack integration, which can be used to post test results to a Slack channel automatically
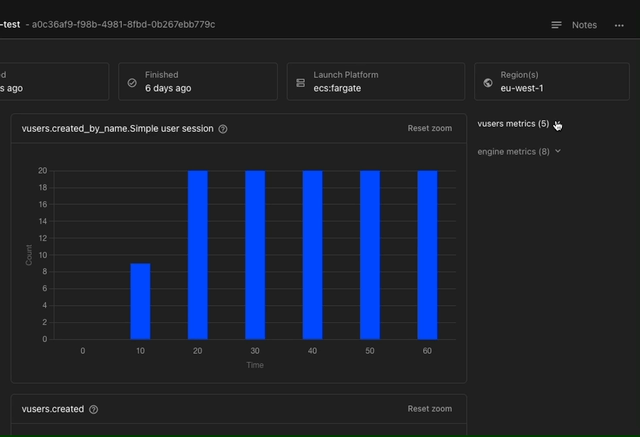
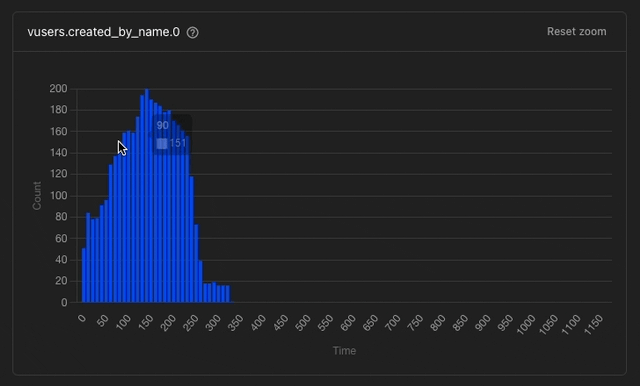
You can now create custom charts with any metrics from your test run. Charts created with the new chart builder are available across different test runs with the same name. Custom charts can also be viewed by other members of your team.
Chart navigator
For long test runs, a navigator is available to help you zoom-in and inspect different phases of your load test. The new navigator is available on the bottom of the chart, and the zoom level is synchronized across all charts, including the newly introduced custom charts.
Bugs fixes & improvements
Show full metric name on all charts
Improve metric units formatting on all charts
Fix issue with long metric names overflowing widgets and breaking some charts
Make expect from @playwright/test work natively with Typescript support - Documentation
Use target as Playwright’s baseURL by default, allowing test scripts to include only relative paths in page navigations (e.g. page.goto('/docs') ) - Documentation
Fix missing phase events in Artillery Cloud when running Fargate tests
CLI & Core
Improve Typescript support to work with more packages, by exposing config.bundling.external to set packages that can’t be bundled as external - Documentation
Make test run id available to test runs via {{ $testId }} in scenarios/config and vuContext.vars.$testId in custom code
Routine dependency updates
Publish Metrics
Automatically send all traces and metrics sent via the opentelemetry reporter with a test_id attribute, making it easier to search for all relevant data from a particular test run
Fargate
Improve error message and handling for putting CloudWatch retention policy
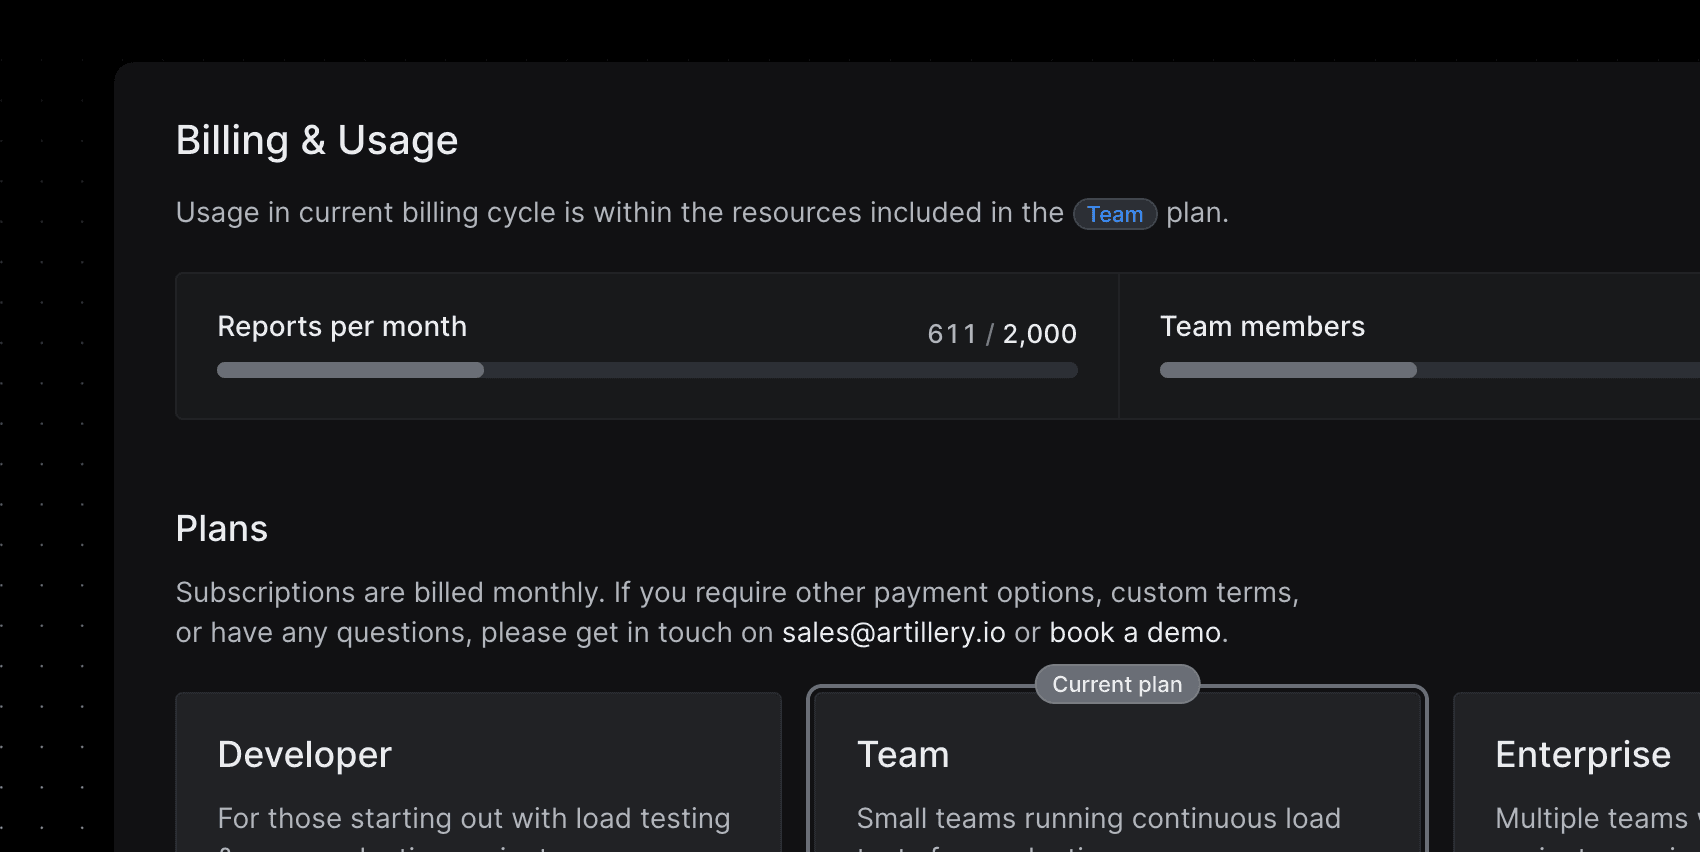
You can now invite new team members and manage existing membership from one screen.
See usage stats and limits
You can see how much of your plan’s quota your organization is using in the new usage stats section in the Billing page. There’s also a new FAQ section to help with any questions you might have around usage limits.
Filter by Date improvements
Filter by date gets a new navigation, with improvements for selecting dates across multiple months. There’s a new Last 7 days shortcut too.
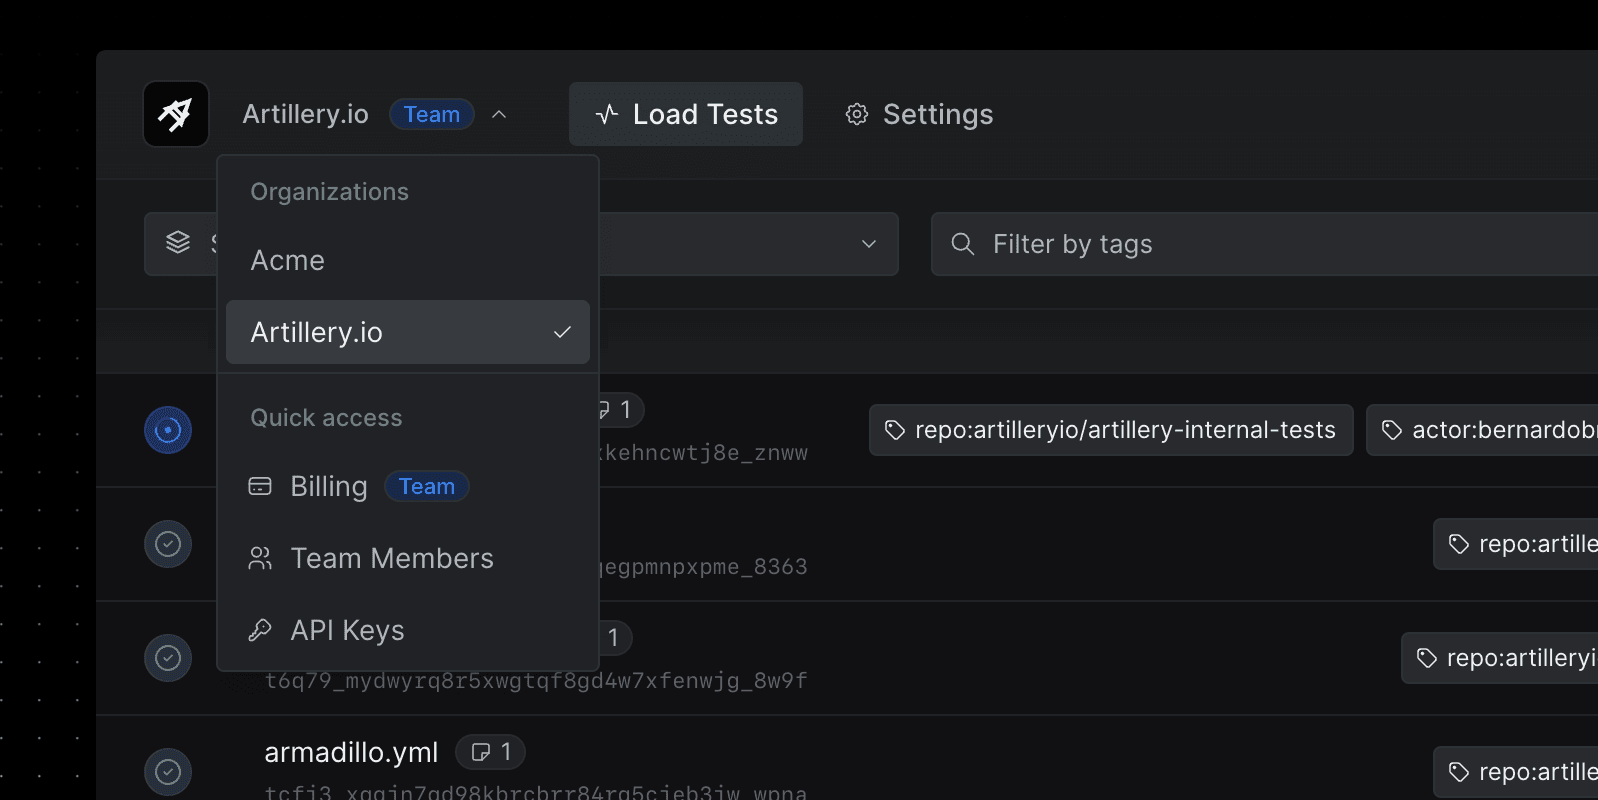
Organization dropdown updates
There’s a new quick access area with links to Billing, Team Members, and API Keys in the organization dropdown. You can now see your current billing plan too.
Enable support for 12 more AWS regions (eu-west-2, eu-west-3, us-east-2, us-west-2, ca-central-1, ap-east-1, ap-northeast-2, ap-southeast-1, ap-southeast-2, ap-northeast-1, me-south-1, sa-east-1 )
Add support for sending Playwright and HTTP traces to Datadog APM - Documentation
Add support for --variables flag in run-fargate command - Documentation
Show supported regions when using the --region flag
CLI & Core
Add TypeScript support for custom code for tests running locally or on AWS Fargate. This is an experimental feature. - Documentation
Playwright
VUs will now run in isolated browsers contexts rather than new browser instances by default for better performance - Documentation
HTTP status codes are now tracked and reported through the browser.page.codes.<code> metric - Documentation
Fix bug in before/ after hooks that prevented the Playwright engine from working - Documentation
Add experimental TypeScript support. See the docs for current limitations - Documentation
OpenTelemetry
Fix issue with virtual users not failing when using test.step() with OpenTelemetry Playwright tracing enabled
OpenTelemetry tracing can now be used to send HTTP and Playwright engine traces to Datadog in Fargate tests - Documentation
Add support for smart sampling when using HTTP tracing with the OpenTelemetry reporter
Unique sharing URLs can now be generated for test reports. This is useful for sharing test reports with people outside of your team on Artillery Cloud.
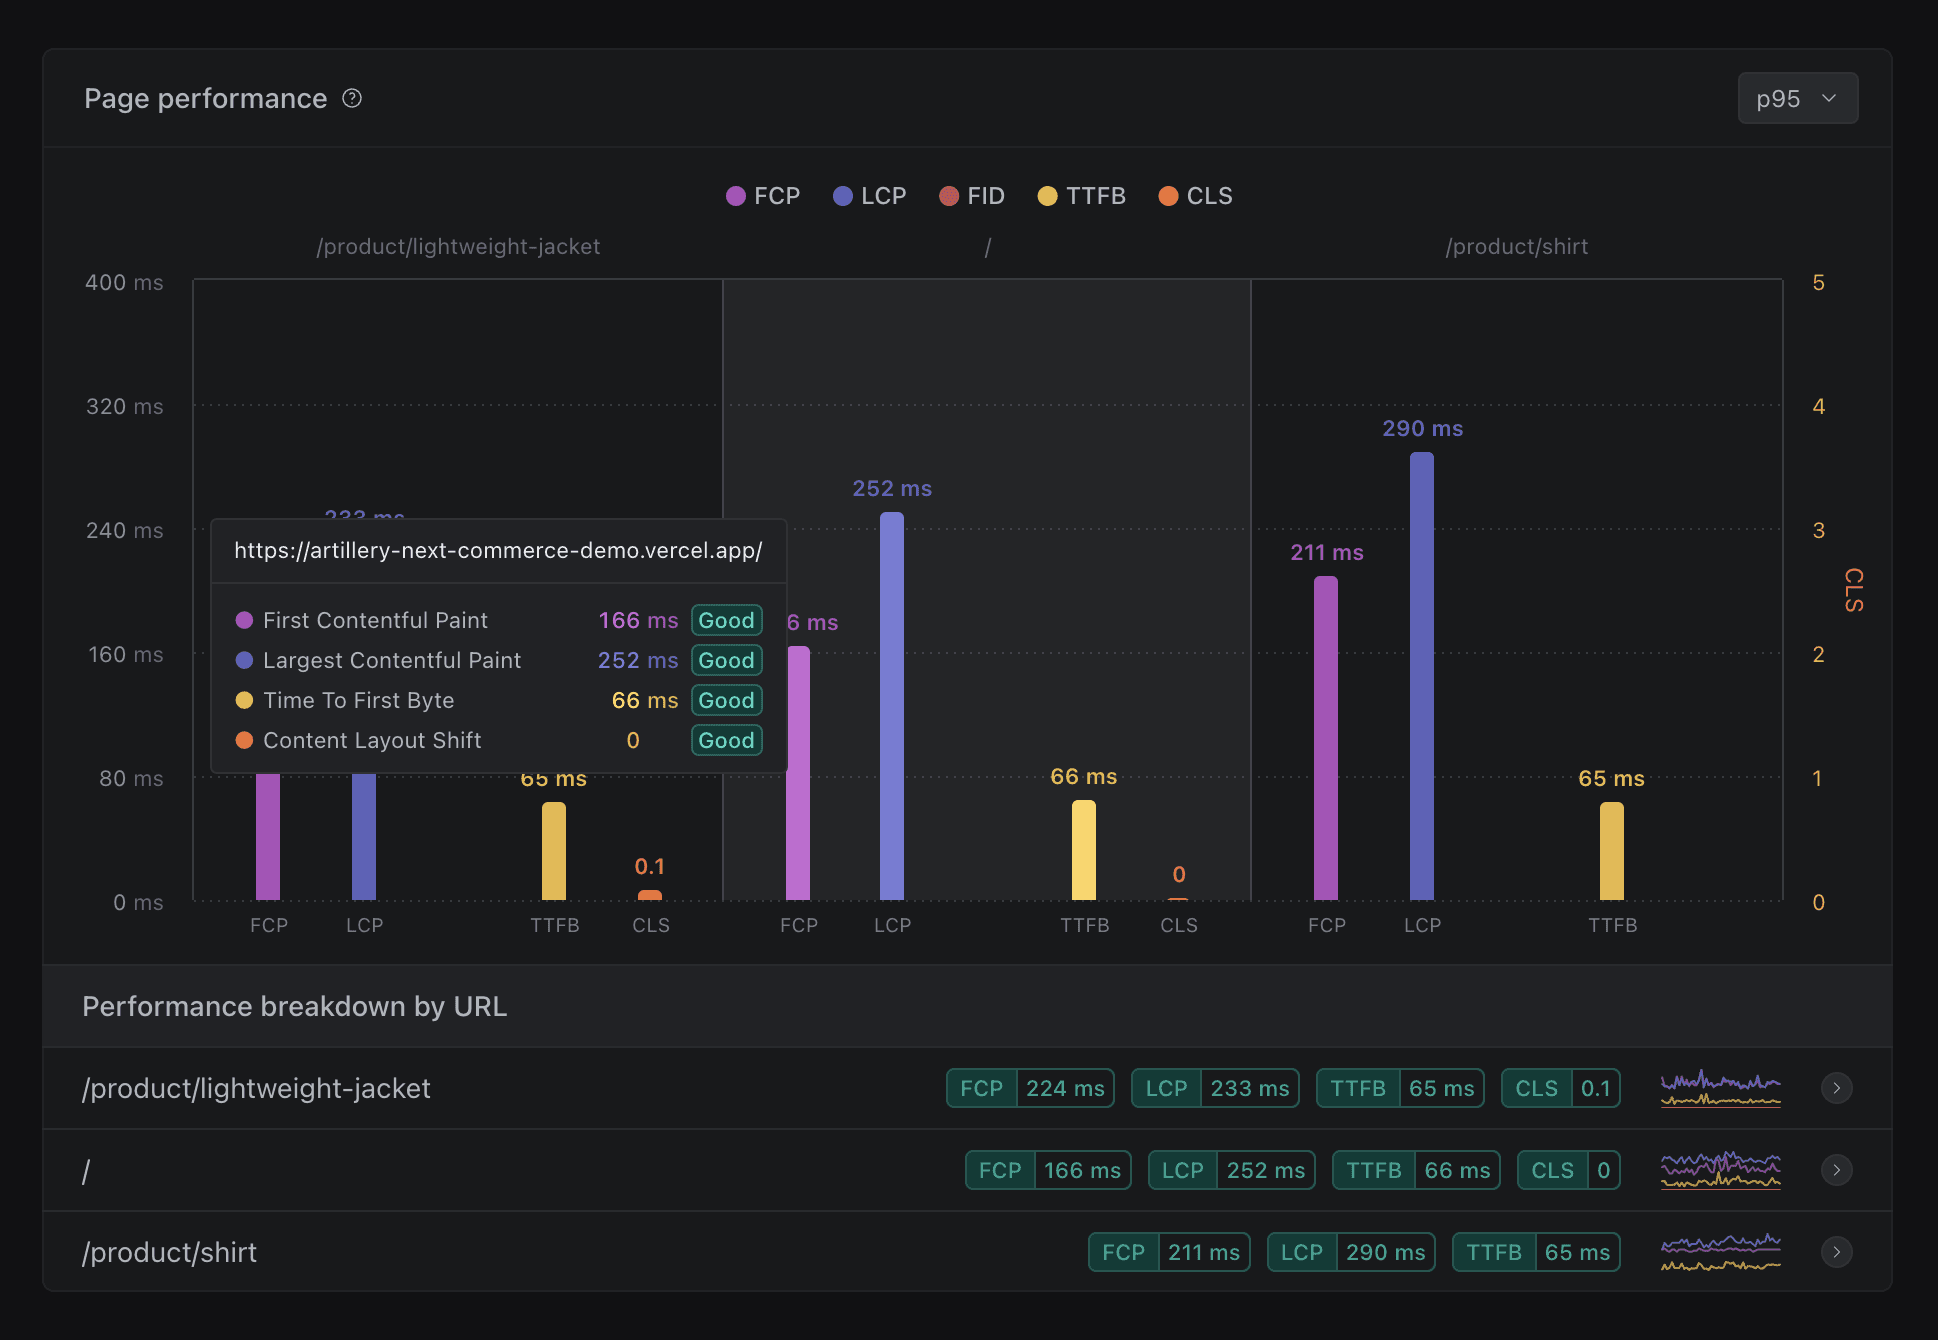
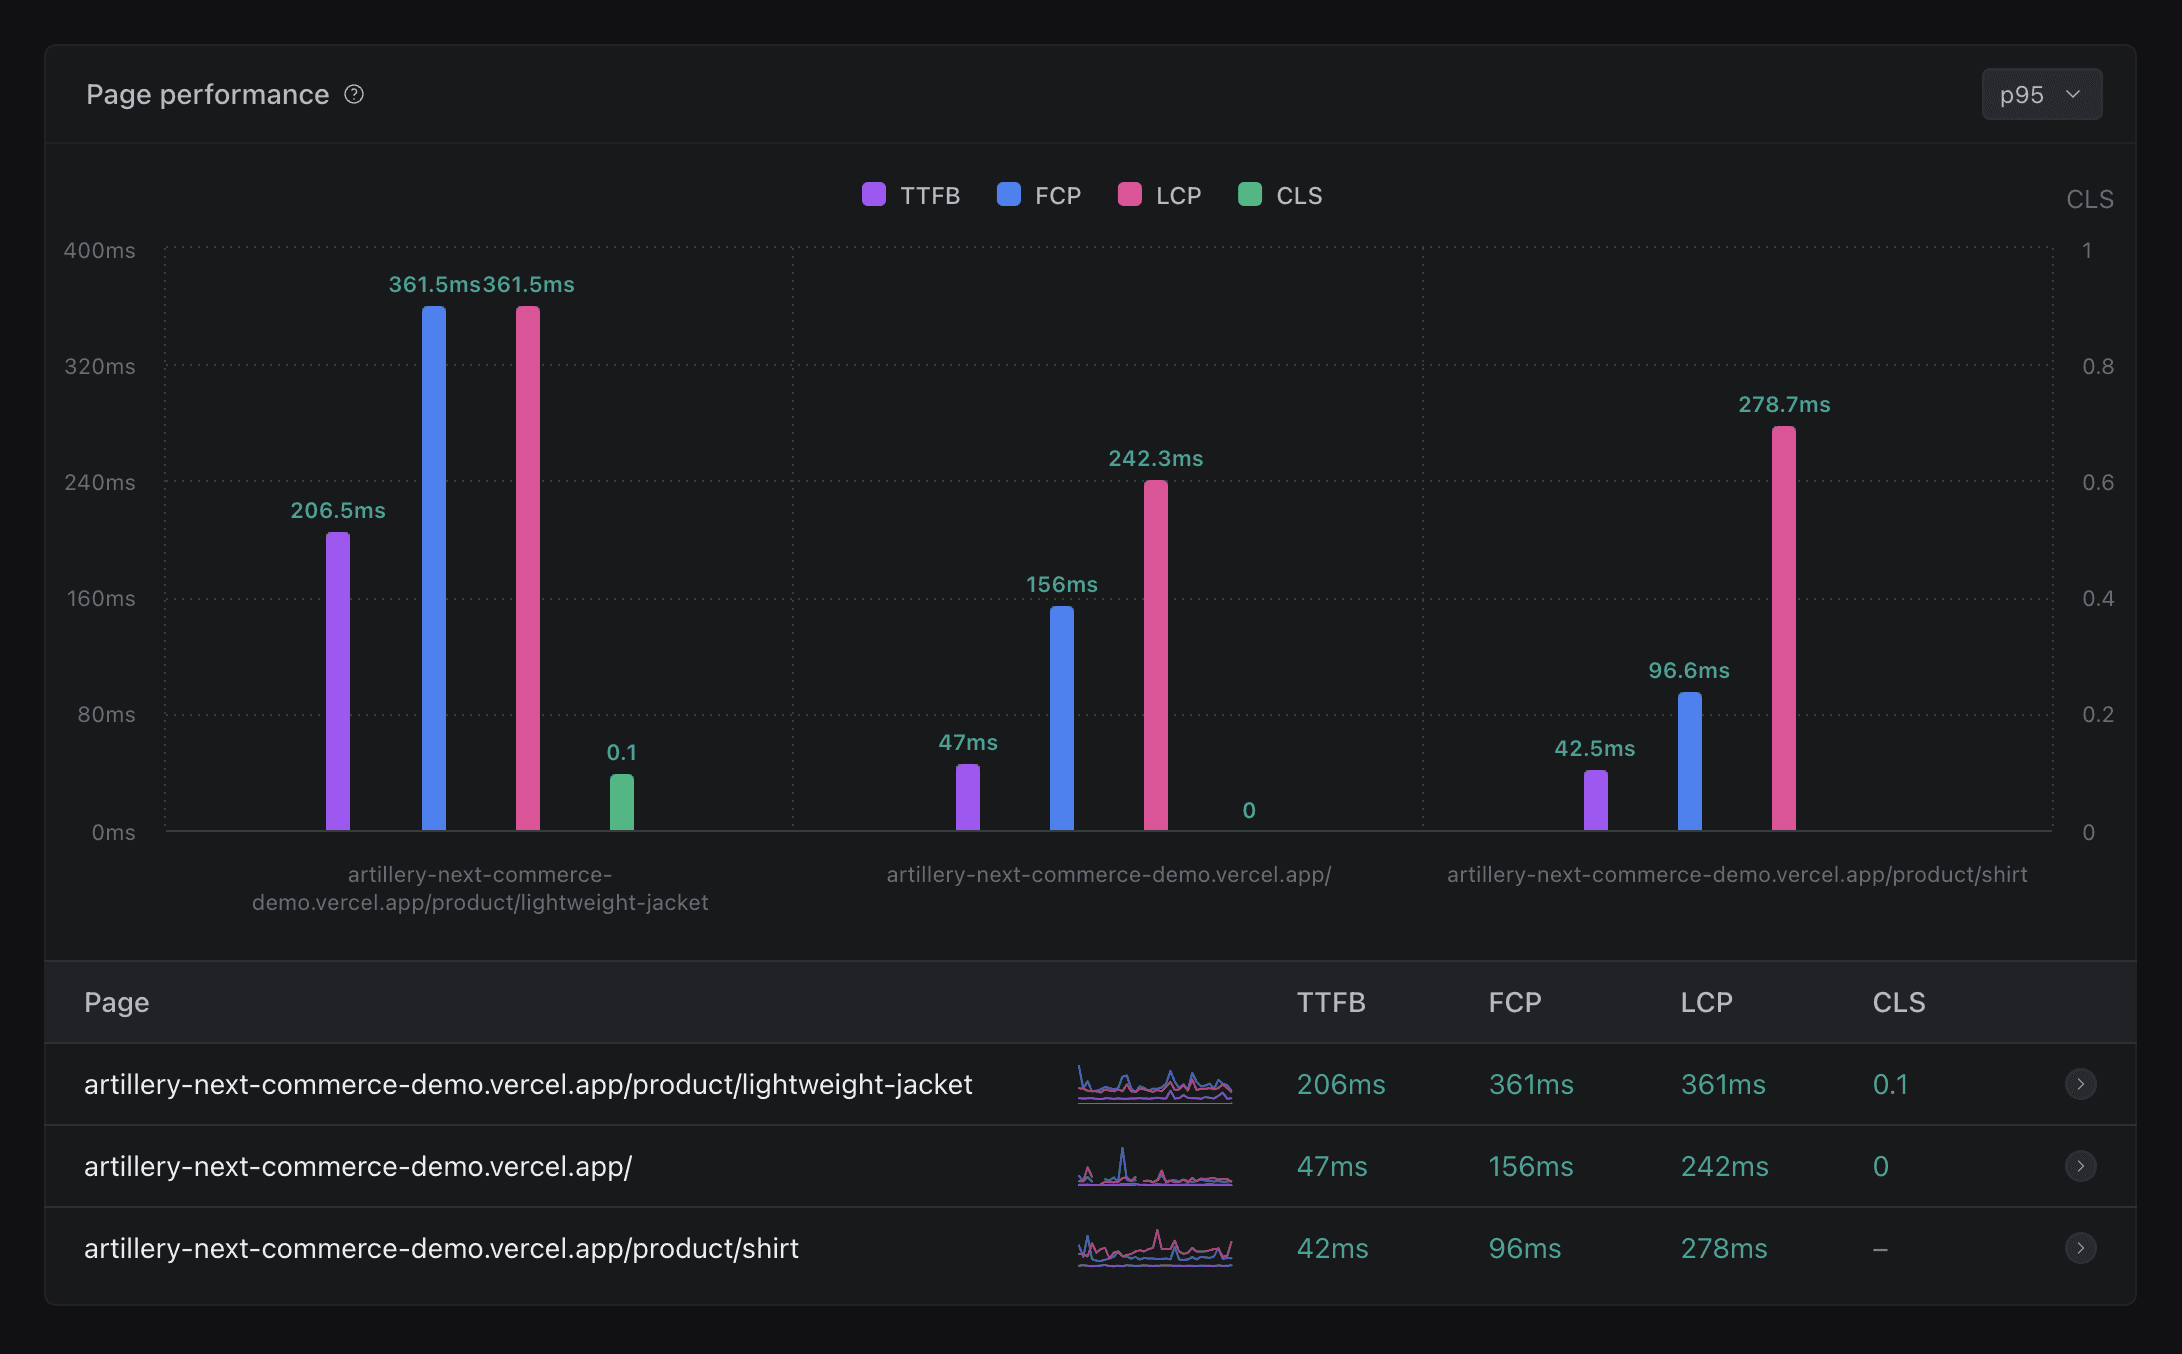
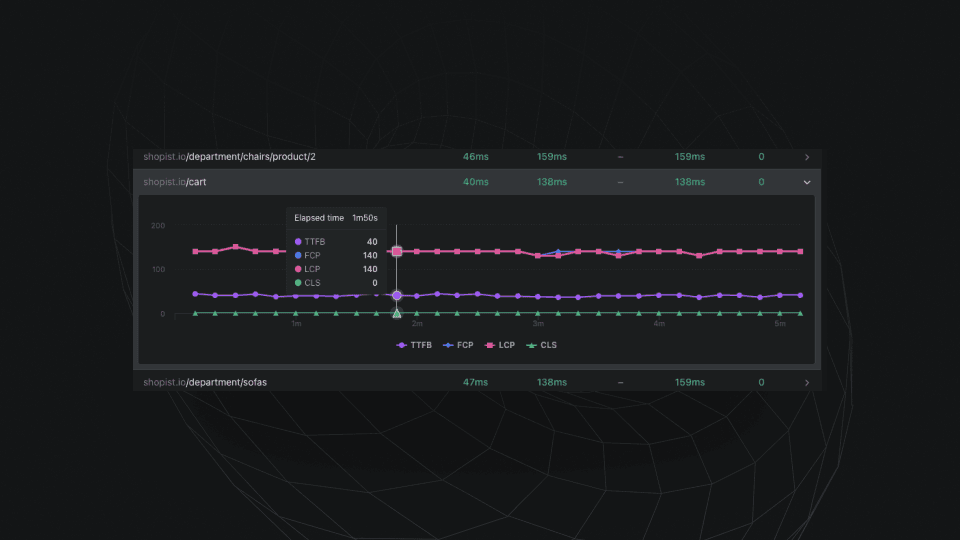
Page performance improvements
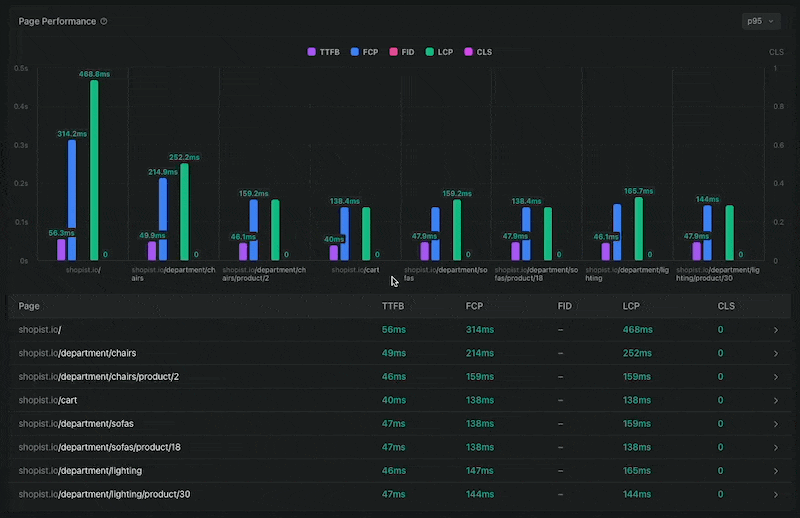
We have updated the colors for the Page performance widget so they are consistent across all charts that have the same metrics. We now show the score (good, fair, bad) for every metric on all tooltips and on also the “Performance breakdown by URL” table.
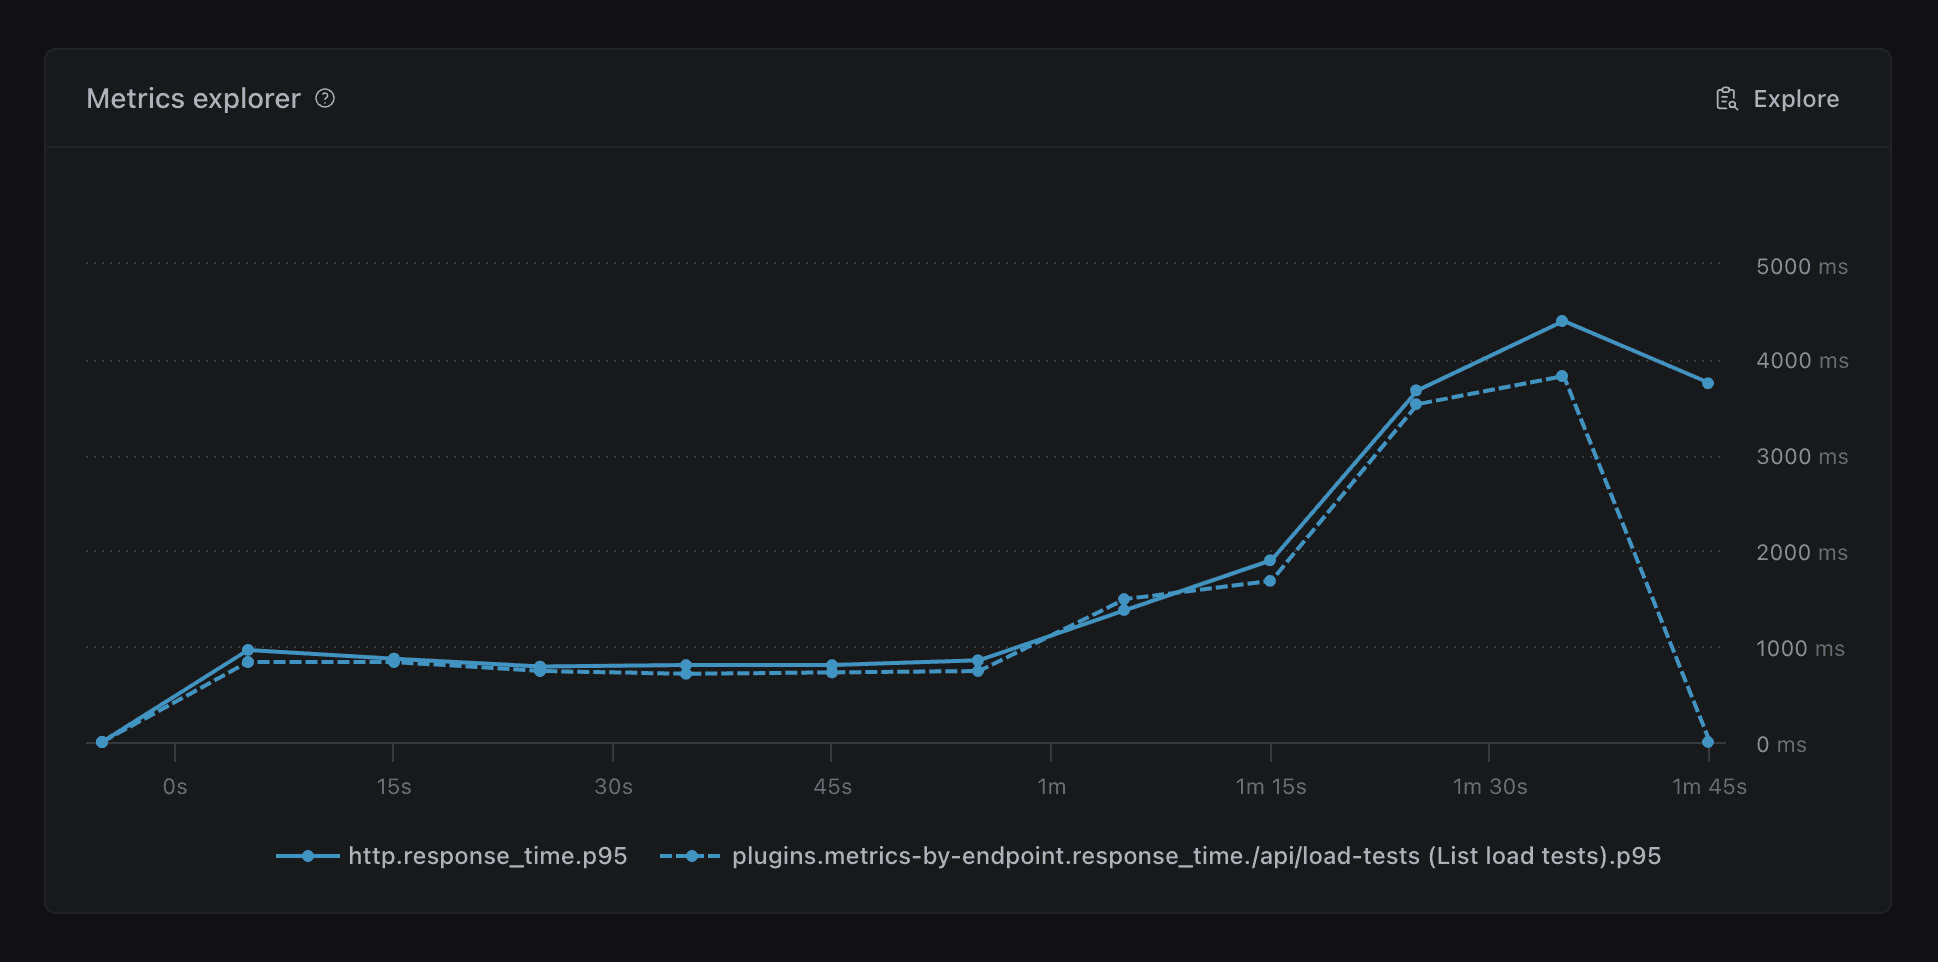
Metrics explorer improvements
When plotting two separate metrics with the same aggregation (e.g. p95) for comparisons, the series lines now show a distinctive style to improve readability.
Sometimes you need to stop a test that is currently running. You can now do this directly from the dashboard.
This works for all Artillery tests that run on AWS Fargate, regardless of whether they are triggered from a developer’s machine or from a CI/CD pipeline.
This feature requires that Artillery CLI v2.0.1 or later is used to run the test.
The artillery-plugin-fake-data plugin will now appear listed under config.plugins, with all different available functions listed to customise their options
config.environments will now have full Intelisense support, with all available config options shown when an environment is listed
Intellisense support for arbitrary key:value pairs in:
Add time unit support for think steps in scenarios
metrics-by-endpoint plugin is now enabled by default to capture per-URL metrics in HTTP tests. The metrics will be available only in the JSON report and not output to the console, unless the plugin is loaded explicitly by the user.
Configure CPU and memory for Fargate tests with --cpu and --memory flags
Fix issue with $env not resolving correctly in the config section
Fix an issue with --scenario-name not picking up the correct scenario
Add a new fake-data plugin to allow for realistic test data to be generated in your tests - docs
Fix handling of metrics with non-alphanumeric characters in ensure checks
Improve error handling in the expect plugin
OpenTelemetry
Add experimental tracing support for Playwright tests, with tracing of test.step() calls, page navigation events, and Core Web Vitals metrics
Display load phase information on all time series charts when you hover over the load phase name.
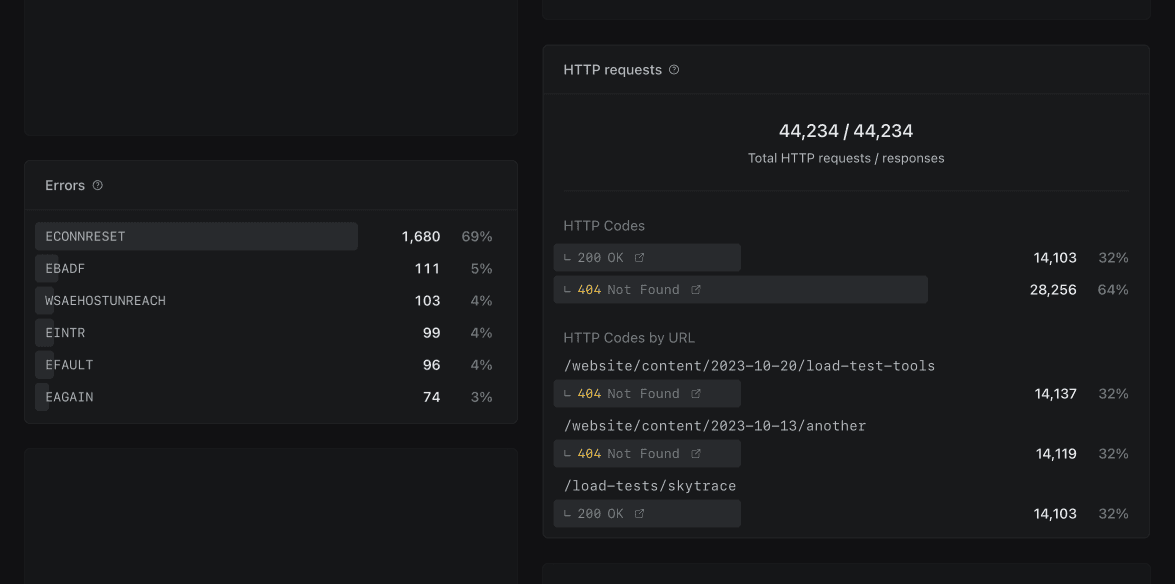
Improvements to HTTP Requests and Errors widgets
Now any errors encountered during the test run will show up in the Errors widget — previously errors would only show at the end of the test run
HTTP requests and Errors show the percentage against the total number of requests
Page performance chart previews
Show sparkline chart preview of Page performance scores per URL over time. This is useful to help you identify any spikes without needing to expand the chart.
Bug fixes & improvements
Improve color contrast across the dashboard
Fix Group by Status test ordering on Load Tests view
We have added custom favicons that show the current test status right in your browser tab. Helps you keep tabs on your running tests and for those with multiple tabs opened.
In-progress test view improvements
Improve loading states for HTTP requests and HTTP response distribution widgets.
Bug fixes & improvements
Fix button not changing to loading state when adding notes
Fix label alignment of x axis for time series charts
Fix HTTP codes widget returning 0 if no data available
Fix alignment of Page Performance table for tests with missing metrics
Add zoom functionality to Page Performance charts
Color HTTP codes on HTTP Requests widget to improve code recognition
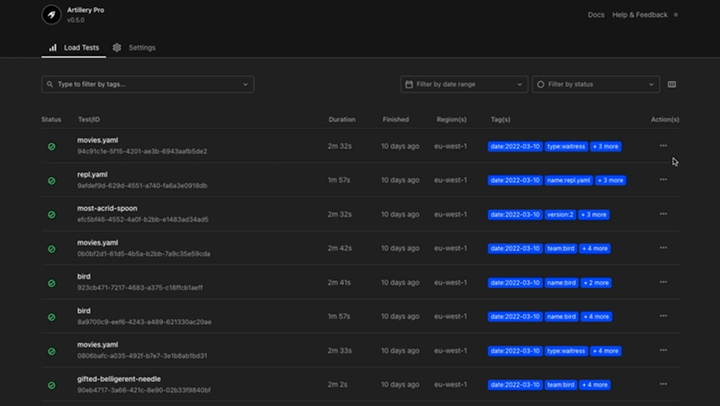
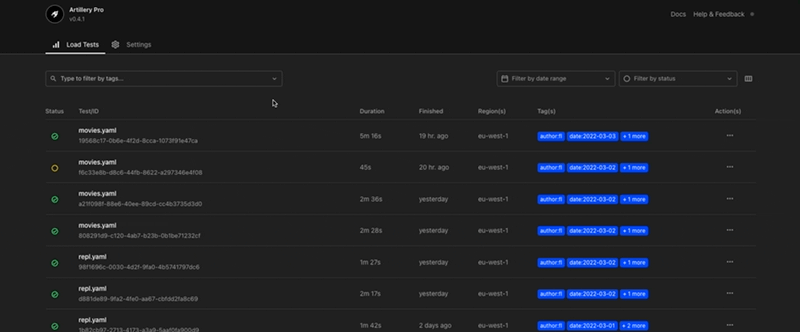
Group views make it much easier to scan through your Load Tests page, specially for users that run a high volume of tests. We have added grouping by date, test status, test name, and user.
In-progress test view improvements
We have improved loading states and help copy on Checks, Errors, and Load Summary widgets.
Loading screen improvements
Improve performance of loading screens and update its design.
Bug fixes & improvements
Improve Load Test page layout
Improve handling of Cancelled tests on the new Activity widget, now it correctly shows when a test was cancelled or finished early
Improve Load Test Reports page navigation
Better visual feedback when submitting notes and editing forms
Improve Logs toggle icon animation
Improve Page Performance table responsiveness
Show more helpful errors in the UI
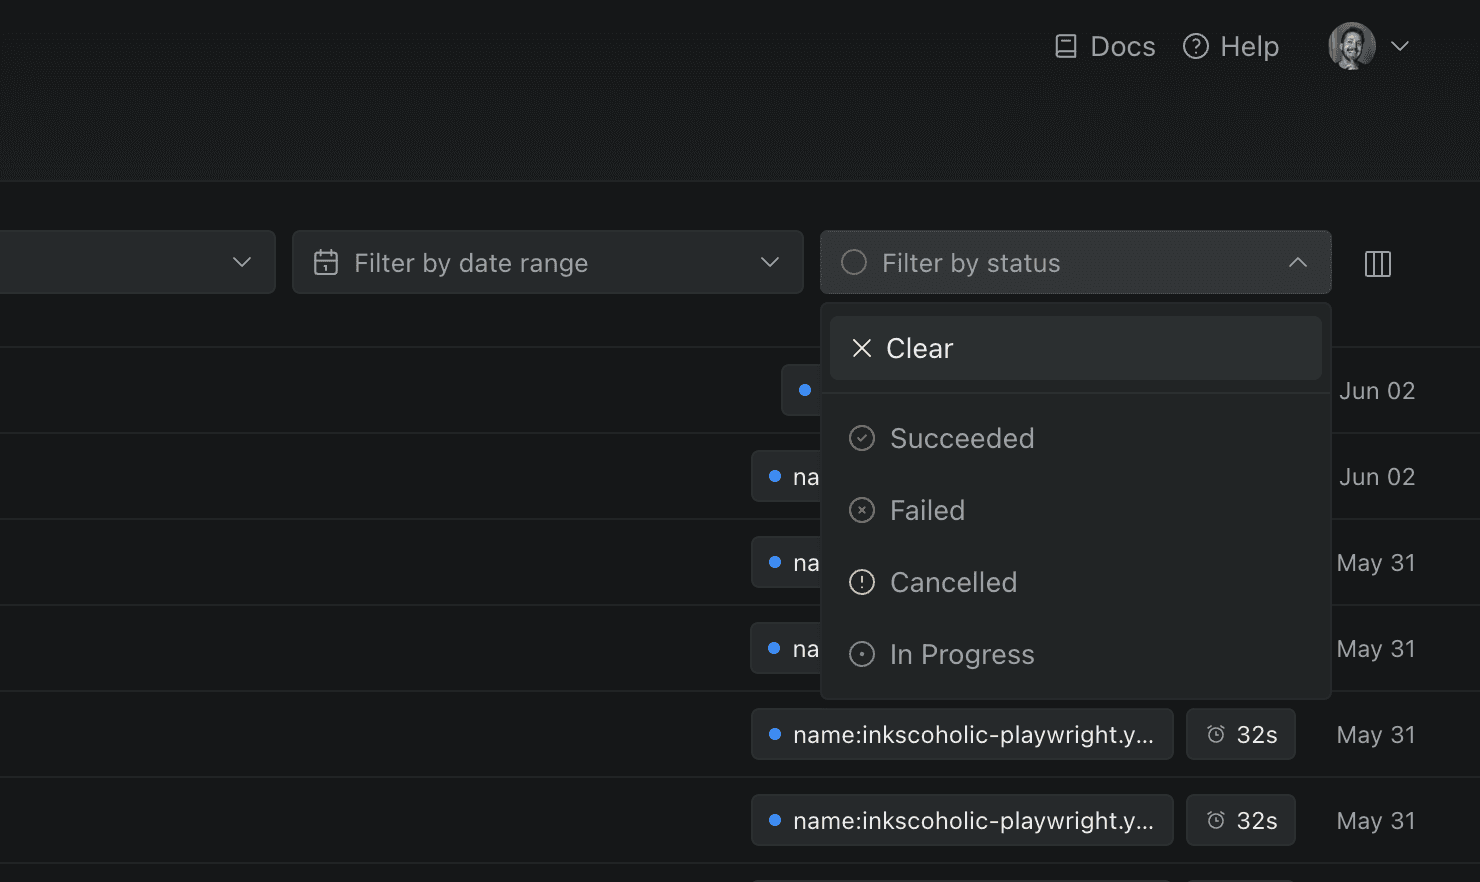
Prevent “Filter by Status” from returning Cancelled tests when filtering by Failed
Fix user avatar aspect ratio on Metadata widget
Fix incorrect scroll position when navigating through charts in the Load Test Reports page
Fix number of virtual users not displaying correctly on Load Summary widget
Fix Notes’ text not wrapping correctly on Notes widget
Fix display properties flashing between default and user-set properties when changing pages
Fix error being displayed when session expires, now it redirects to the Login page instead
Fix button loading states incorrectly triggered when adding or editing notes
Fix Test Logs area expanding after user collapses it
This update is focused on many small improvements to improve overall information density and make it easier to understand load testing activity at a glance, as well as to make it easier to analyze individual load test runs.
New features
Test list view
The results of checks can now be inspected inline. The count of notes added to a test will is now also shown inline.
Elapsed time is now updated live for in-progress tests
Display relative dates in the list view, and show the full timestamp on hover
Tests that run on AWS Lambda and AWS Fargate will now be shown with the appropriate icon for those services
Load test view
All timeseries charts will now overlay the name of the load phase and show absolute timestamps for X axis labels
Add metric toggles to for hiding/showing specific aggregations on HTTP Latency Distribution widget
Make metadata view more compact and easier to scan
Improve empty states on Checks, Metrics Explorer and Errors widgets
JSON reports can now be downloaded from the context menu
Bug fixes & Improvements
The list of tags will now show more tags by default to increase information density
The name tag is no longer shown in the list of tags (the name tag sets the name of the test shown in the list)
Match styling of tags in filter dropdown to styling used elsewhere in the UI
Fix a bug with date filter not always resetting the selected range as expected
Fix a bug in date filter where the displayed range could be off by one day
Fix a bug in date filter where future dates would be shown in date filter
Fix content overflow on Errors widget when there’s a lot of error data
Fix a bug where filtering by tags would not work correctly
Fix a bug where filtering by status would not work correctly for tests that included failed checks
We’ve reorganized the layout of individual test reports to make notes more prominent, improved readability of the metadata section, and created more room for useful visualizations in the main area.
Test view sidebar
Notes
Notes provide a way to annotate test runs with useful information such as links to external logs and dashboards, and for recording results of investigations into performance issues found by load tests.
We’ve now pulled them out from a separate view to make them more accessible.
Other fixes & improvements:
Remove shadow overlap on first note
Tweak microcopy to make actions clearer
Metadata display
Test timing information has been moved into the sidebar to give more space for data widgets in the main area
Make Metadata section collapsible
Improve spacing on list of CloudWatch Log Streams for Fargate tests
Move “Add note” to the top so notes are added right below it, better UX
Tweak styling of rendered Markdown for better readability
Improve handling on small screens
Improve alignment and padding of metadata items
Load test visualizations & insights
Fix issue that could cause all charts to rerender when not necessary and lead to charts jumping around
Improve responsiveness of Page Performance widget
Improve spacing on Error summary view
Add empty state to Counters summary
Test IDs can be copied by clicking them
Other fixes & improvements
Fix bug that could cause new tests to show up as “Untitled Test” for a short period of time
Fix bug that prevented deep links to charts from working
Error dialogs and error handling. Error responses in both the UI and API will now include unique error IDs that are tied to error logs
Fix bug that would cause some pages to show loading skeleton indefinitely for logged out users
Fix alignment of loading indicators on buttons across the app
Improve contrast for all popovers and dropdown menus across the app
Make styling of all external links consistent through the app
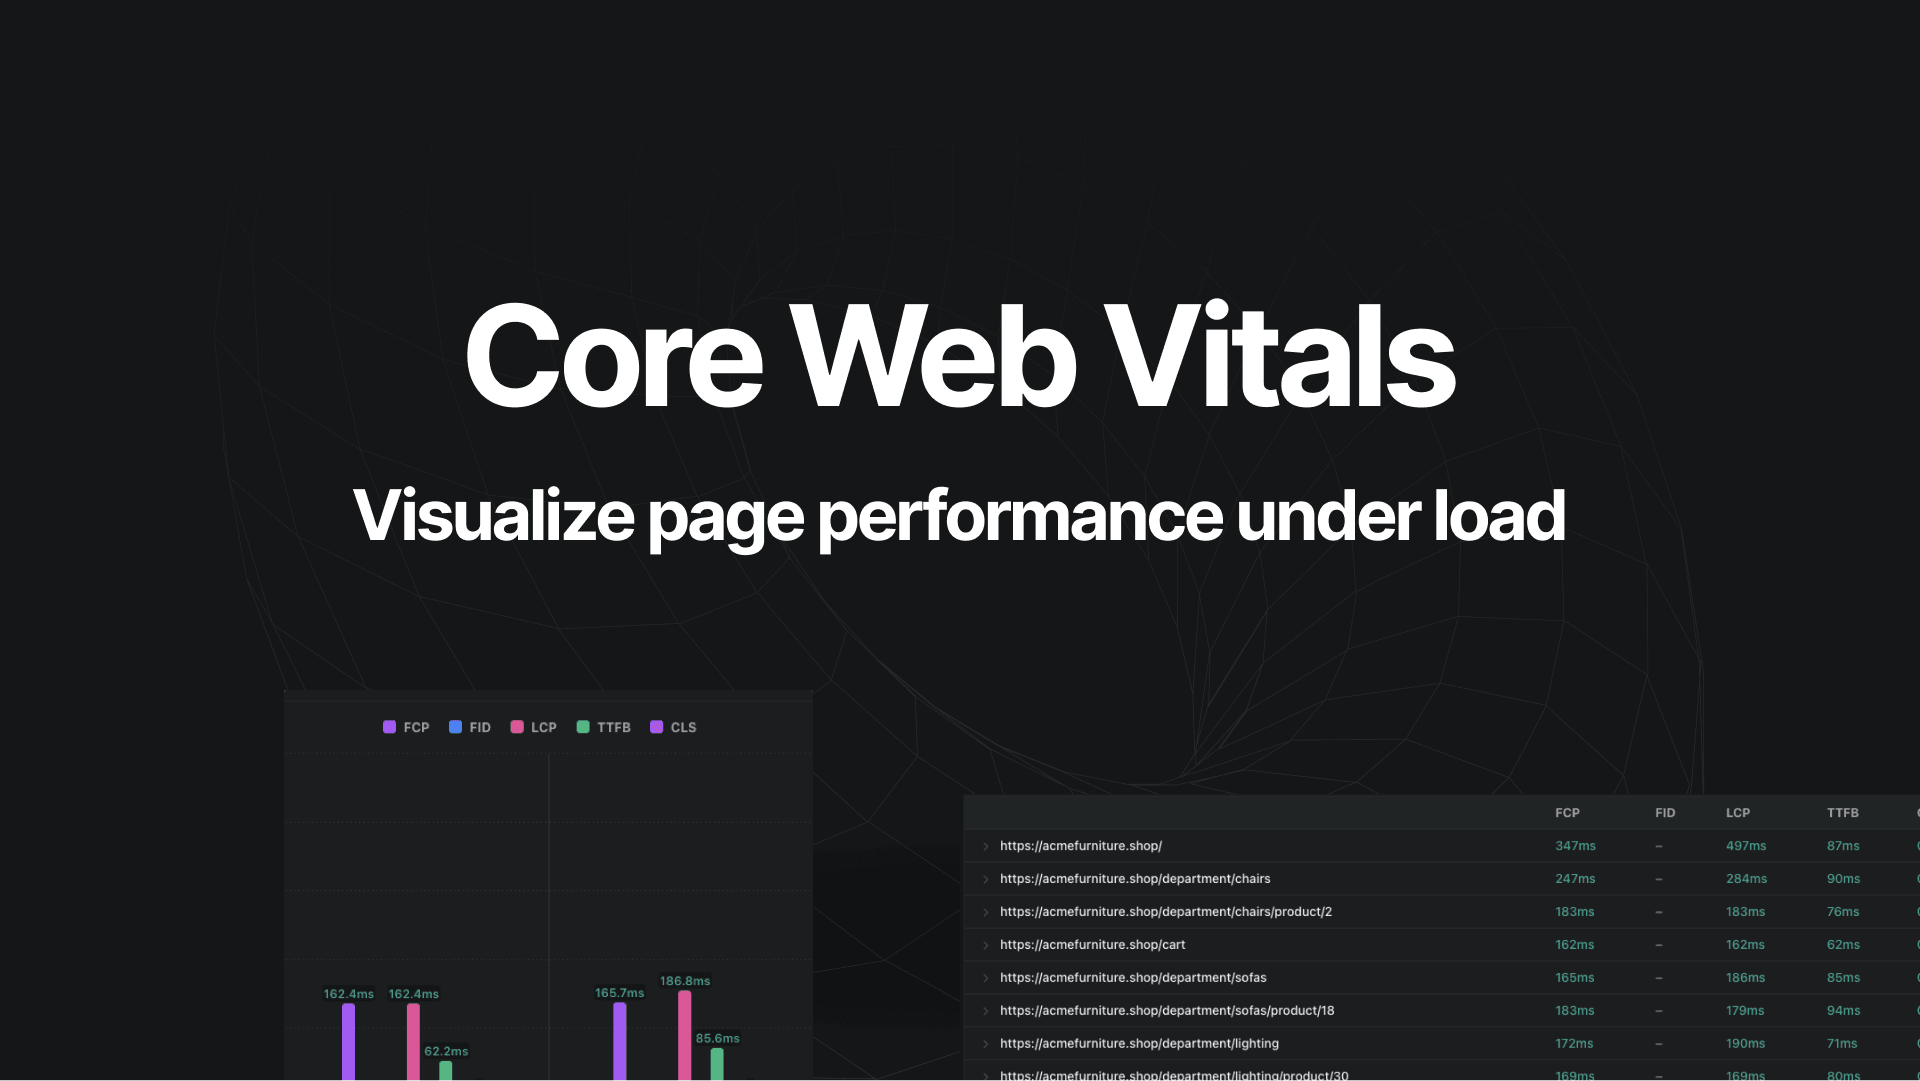
Core Web Vitals is a set of key frontend performance metrics that measure user-perceived performance of a web application.
The dashboard will now visualize the performance of every page for load tests that use Artillery’s Playwright integration. This will help you understand how user-perceived performance is affected by high load.
The load test summary view will now calculate and display Apdex scores for load tests that make use the built-in apdex plugin.
Apdex (Application Performance Index) is an open standard for measuring performance of HTTP services. The Apdex score converts response times into a single score that reflects user satisfaction with the service.
Fixes & Improvements
App-wide
Update colors to improve legibility and consistency
Add exit animations for all dropdown-like elements
Improve loading states on all buttons
Improve consistency of dialogs everywhere
Improve consistency of spacing between elements across the app
Main view
Tweak the display of Artillery’s logo in the navbar
Fix responsiveness on Load Tests view
Improve UX for Saved Views and the Filter Bar with long input strings
Match test run ID icon in filter dropdown to one used elsewhere
Load test view
Make font sizes consistent in metadata panel
Improve styling of text log view, JSON log view, and table components
Fix issue with loading default CLI avatar images on notes
Fix issue with scroll gradient covering first note in the notes list
Improve spacing on Edit Note dialog
Charts
Add intelligent X axis scaling depending on duration of the test
AWS Fargate is a serverless solution that requires no infrastructure to be managed, and unlike AWS Lambda does not impose a restriction on the duration of your load tests.
Artillery’s Playwright integration is fully supported on Fargate, to let you run browser-based load tests at scale with ease.
Playwright support
Playwright support is now built into Artillery. The integration in artillery-engine-playwright is now bundled into the Artillery CLI.
The version of Playwright used by the integration has been updated to v1.3.4
Web Vitals tracking has been improved to provide more accurate measurements
Playwright scenario file may now be loaded via testFunction attribute rather than flowFunction
flow attribute may now be omitted in Playwright engine scenarios
Other fixes & improvements
Pass lambdaRoleArn to AWS Lambda engine correctly
Fix issue with returning matched groups from regexp capture
Track & report downloaded data in HTTP tests via http.downloaded_bytes metric
Environment variables may now be accessed through the special $env variable (the current way of accessing those via $processEnvironment is still supported but will be deprecated in future)
Dependency updates to address deprecation and security notices
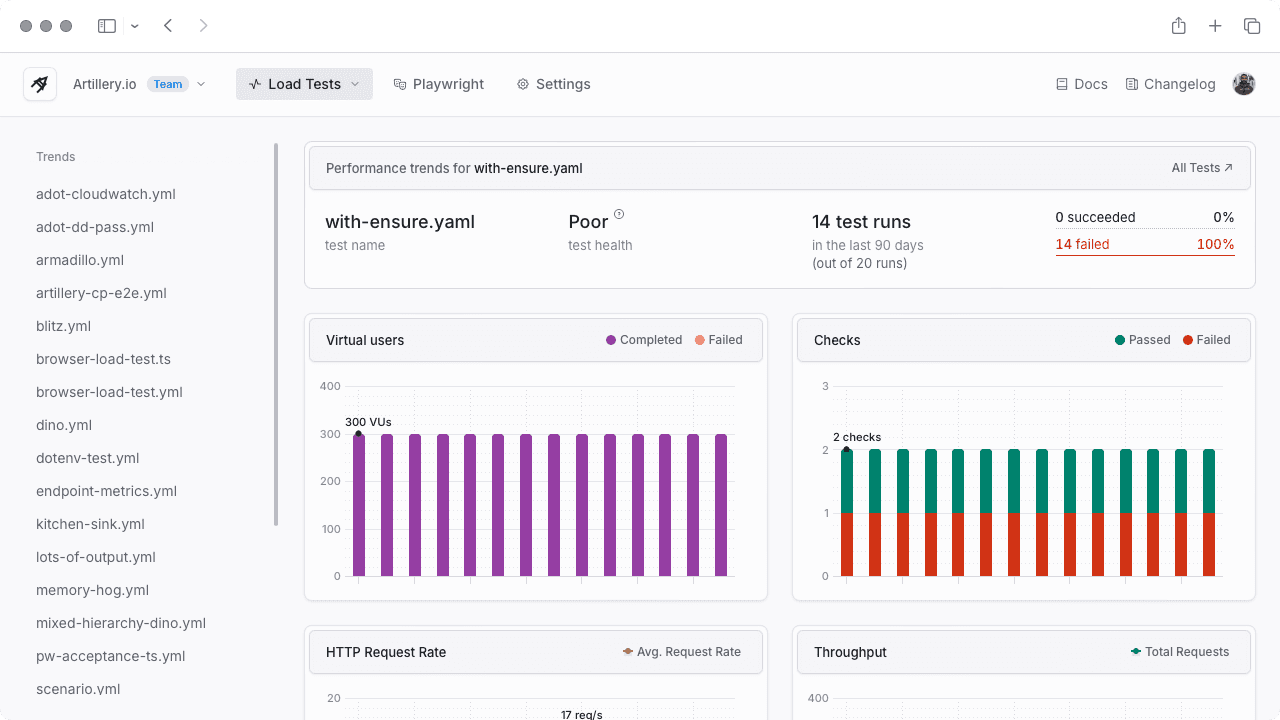
The main load test list now shows the results of ensure checks so that you can see at a glance which tests succeeded and which ones did not meet performance thresholds.
We recommend using ensure checks for all regular tests to help make sure that performance goals are met.
Simplified status filters
We have reduced the number of status filters down to just four: Succeeded, Failed, Cancelled, and In Progress. A test run that sets ensure checks is marked as Succeeded only if all checks are successful.
A fresh lick of paint
We have done a comprehensive overhaul across the whole interface of the application, updating component surfaces, font sizes, animations, and more, to make the UI feel more consistent, accessible, and easy on the eyes.
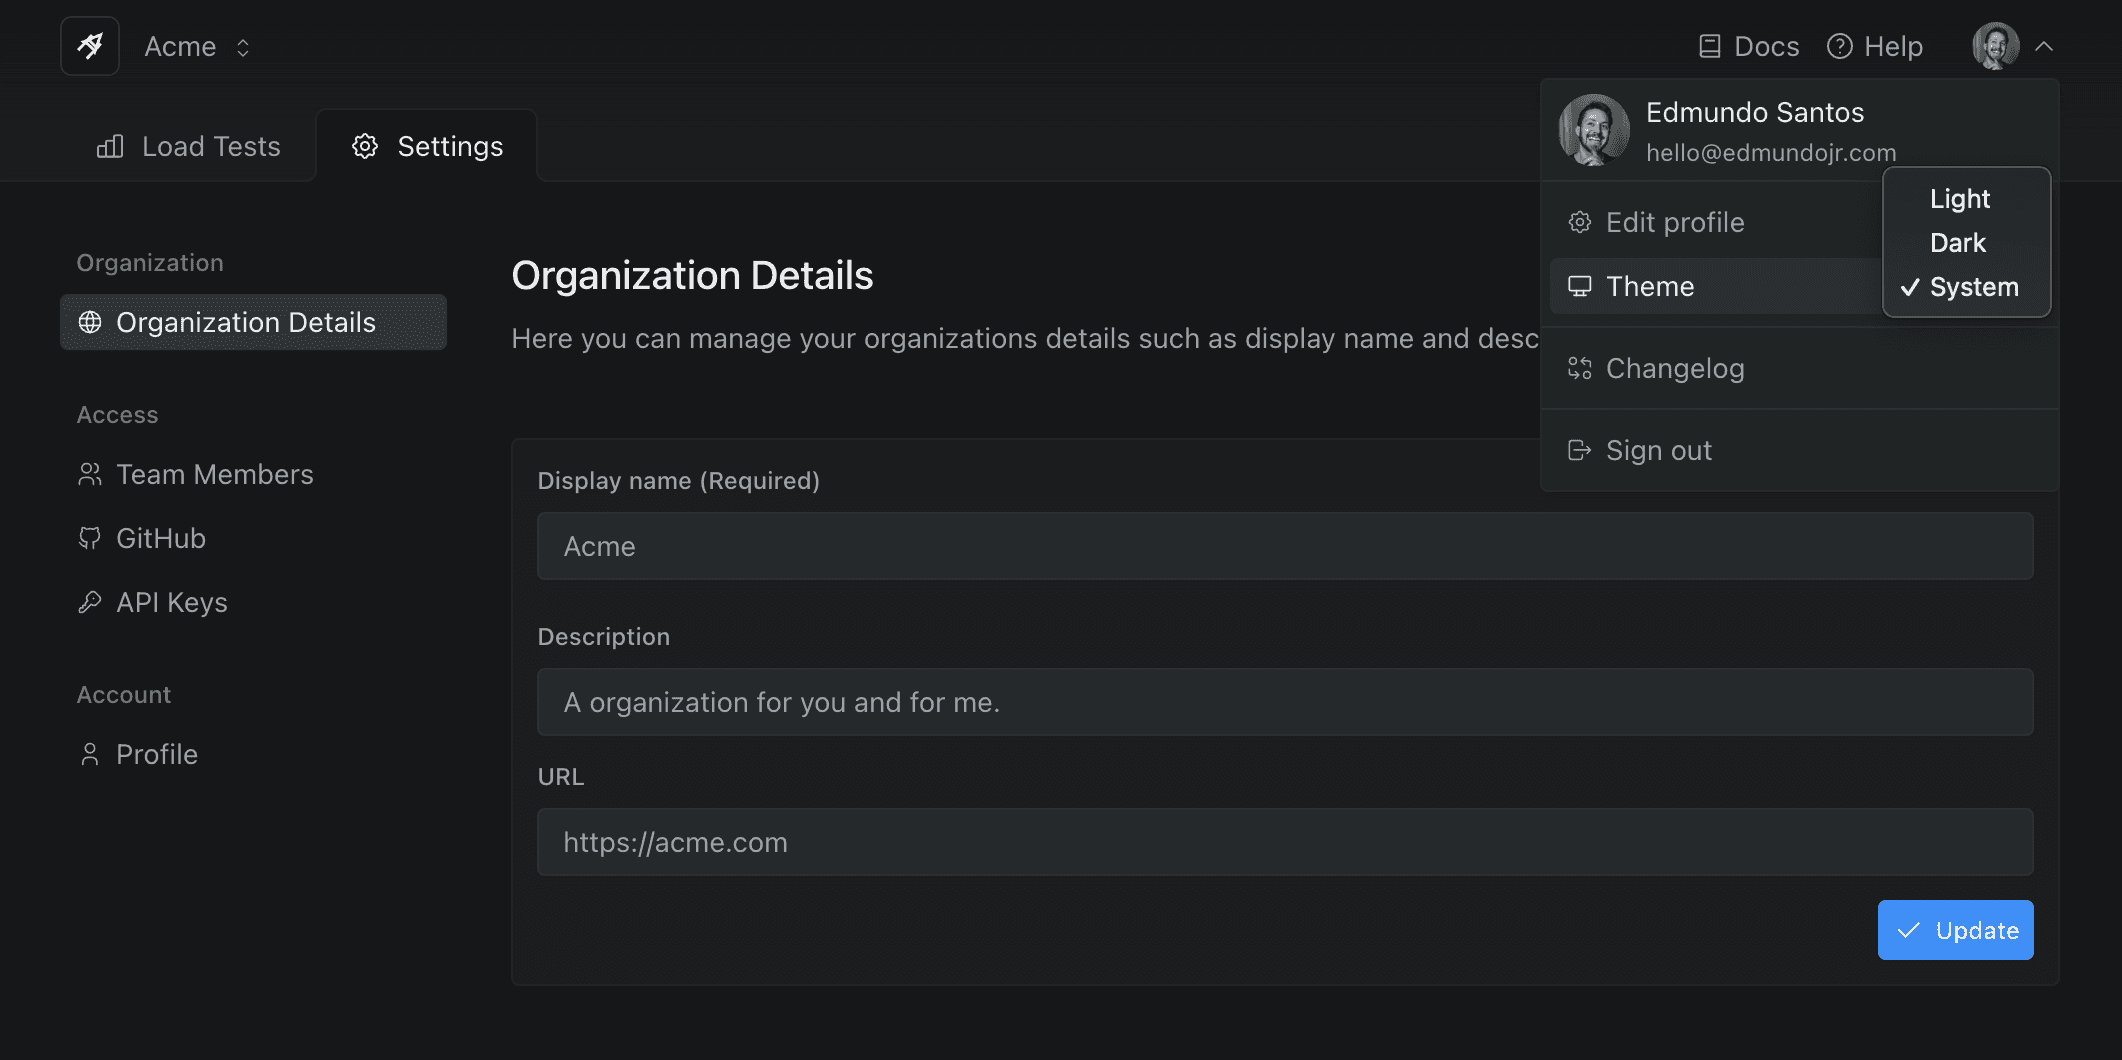
Settings management
The Settings area has been updated to make navigation easier and now includes the ability to edit organization and personal details.
It’s now also possible to pick a “system theme” which makes our UI follow your operating system’s light/dark theme.
Fixes & improvements
Performance improvements: faster loading of individual load tests, and settings pages
Fix bug with searching by test run ID that would cause older test runs to be omitted
Make Settings navigation fully responsive on mobile
Add infinite scroll for the main load test list view
To make getting to the information you want faster, the dashboard supports Saved Views now. Any combination of tag filters, date filters, and test status filters can be named and saved as a view.
Team member and auth management
You can now manage current team members, and the GitHub allowlist that determines who may join your organization from the Settings area.
Live test updates
Overview pages are now live and can be used to follow the progress of an in-progress load test.
Denser and more scannable list view
We improved information density and scannability of the main load test list view. The default page size has also been increased from 10 to 50.
AWS Lambda - when running tests on AWS Lambda, Artillery will automatically bundle any plugins loaded via config.plugins and engines loaded via config.engines
Checks & assertions: new notStatusCode check in the expect plugin
Datadog integration: includeOnly and excluded options may be used to configure the list of Artillery metrics which will be sent to Datadog
Fixes & improvements
When artillery run is used with the --output option, Artillery will check if destination exists before running the test
Miscellaneous dependency updates to address deprecation warnings and security advisories
AWS Lambda: the default IAM role and policy are now versioned. If you attached any custom permissions to the artilleryio-default-lambda-role role, you will need to re-attach it to the new artilleryio-default-lambda-role-20230116 role
CLI: The probe command has been removed from the CLI. The functionality has been moved to the new Skytrace CLI
New features
Add support for publishing test metrics to AWS CloudWatch
HTTP - compressed responses (e.g. gzip) will be decompressed by default now. (Set gzip: false to disable automatic decompression if required to improve performance.)
CLI - suggest closest match if a command name is mistyped
AWS Lambda
Print custom role ARN if provided
Add versioning to default Lambda role and policy created for running tests
Fixes & improvements
Fix arrival phases with arrivalRate and rampTo set to 0
Improve rampTo logic to result in more predictable and deterministic ramps
Fix issue with maxVusers setting that would lead to unexpected number of VUs to be generated
Fix wildcard message handling support in Socket.io
Fix issue with setting some properties on the global artillery object
AWS Lambda
Improve test startup logic: workers will wait for each other to be ready before kicking off the test run
Fix some intermediate metrics not being flushed & reported
Fix handling of memory-size and security-group-ids options
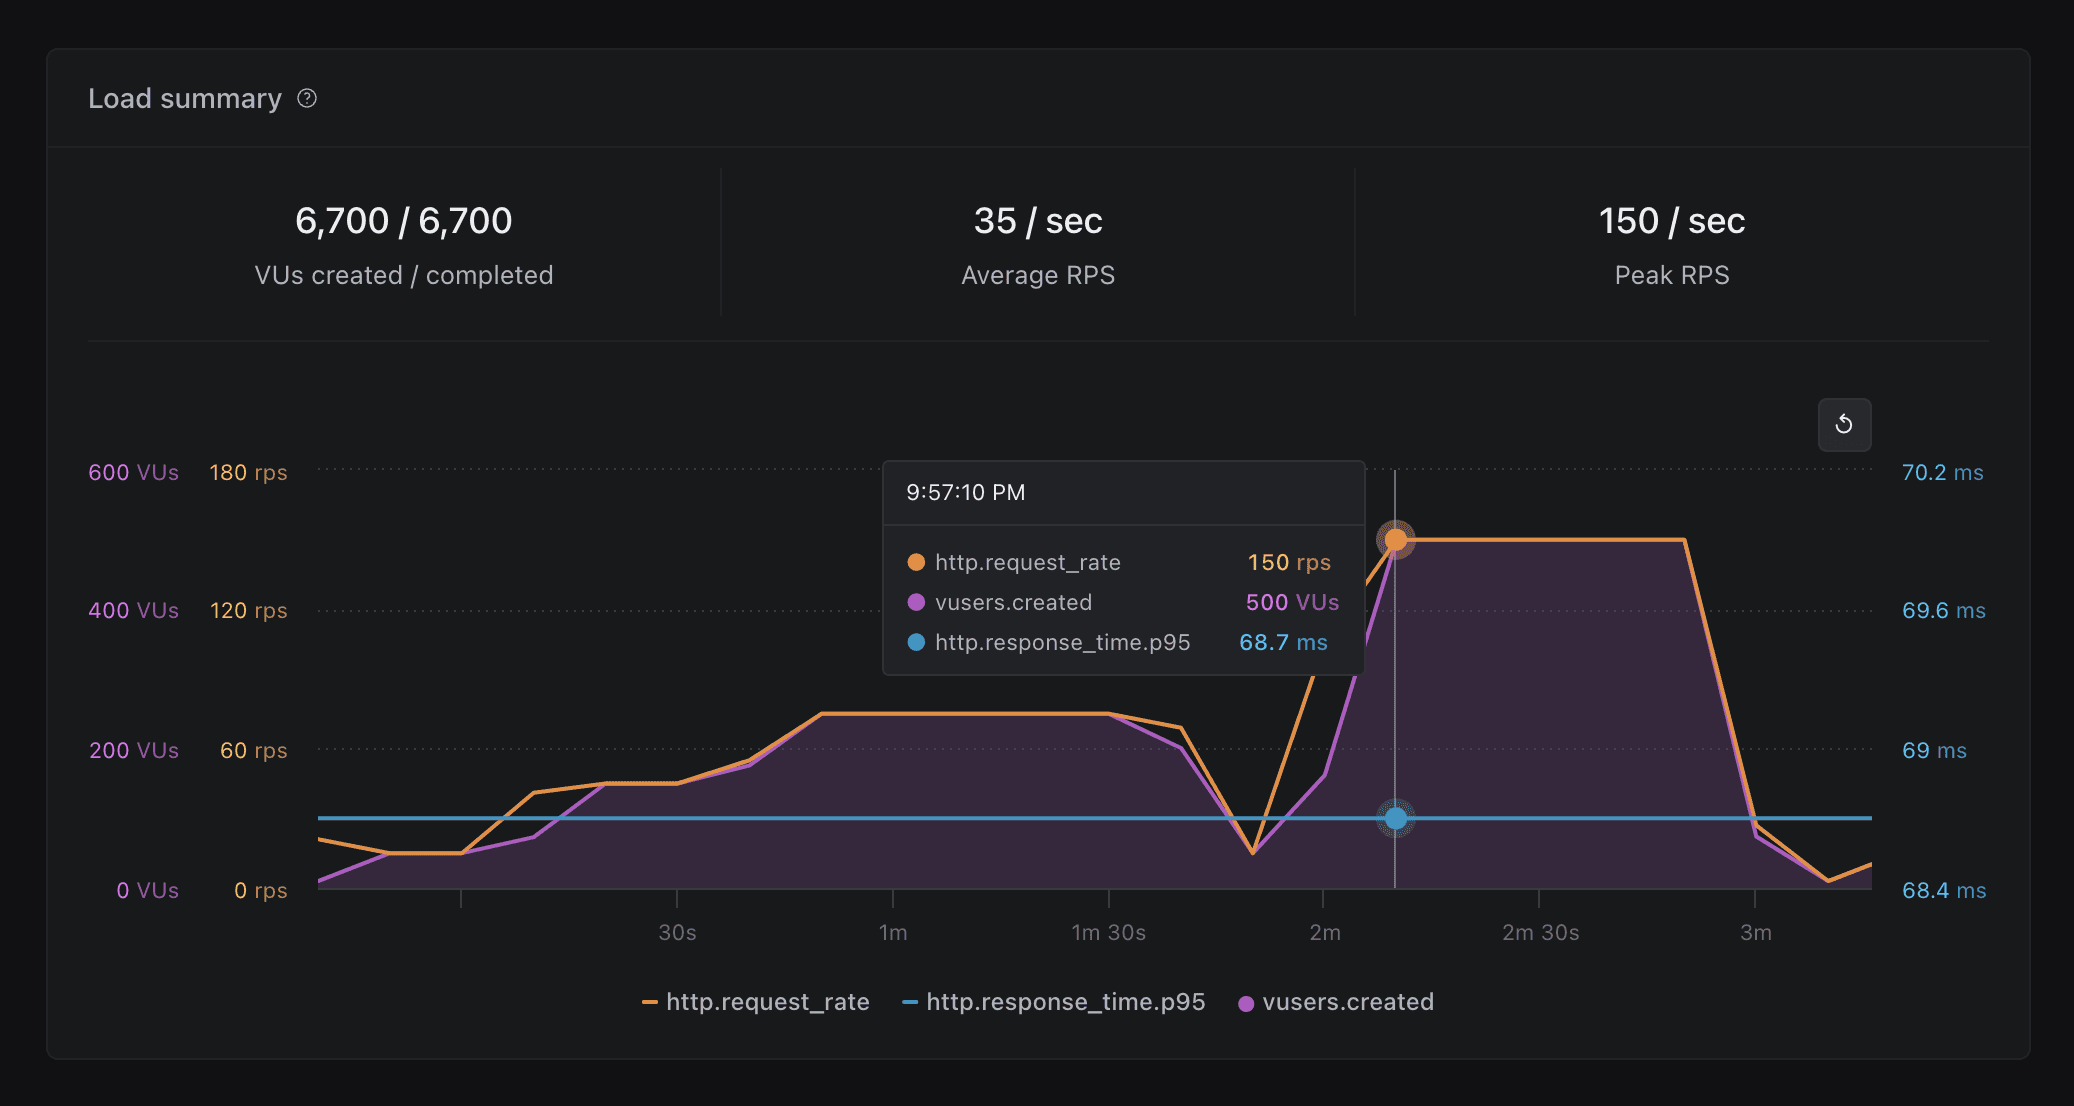
We have released a big update to the Artillery Dashboard with a focus on improving the Overview section and our charting engine to let you understand load test results faster.
Load Test Overview
Show Peak RPS achieved during a load test run
Display errors (if any) at the top of the screen
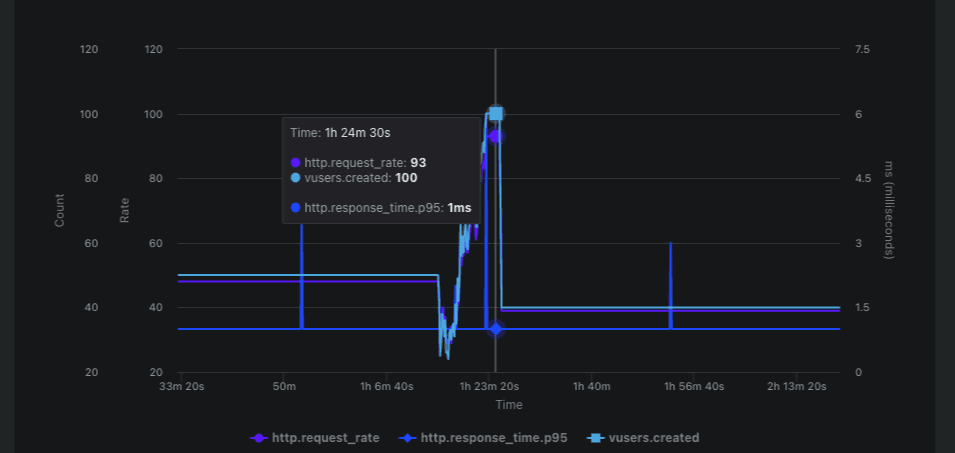
New “Load Summary” chart to visualize request rate, response time, and VUs created across the test run
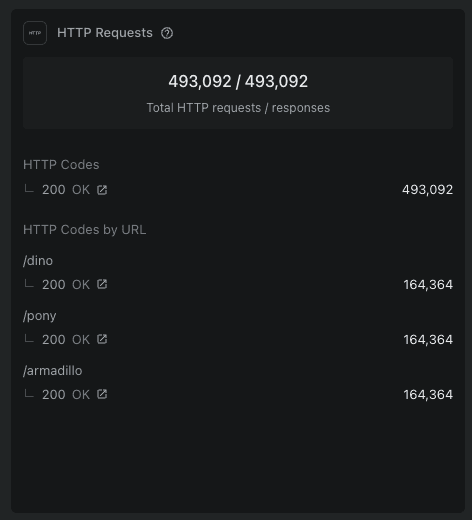
Show a breakdown of HTTP codes by URL
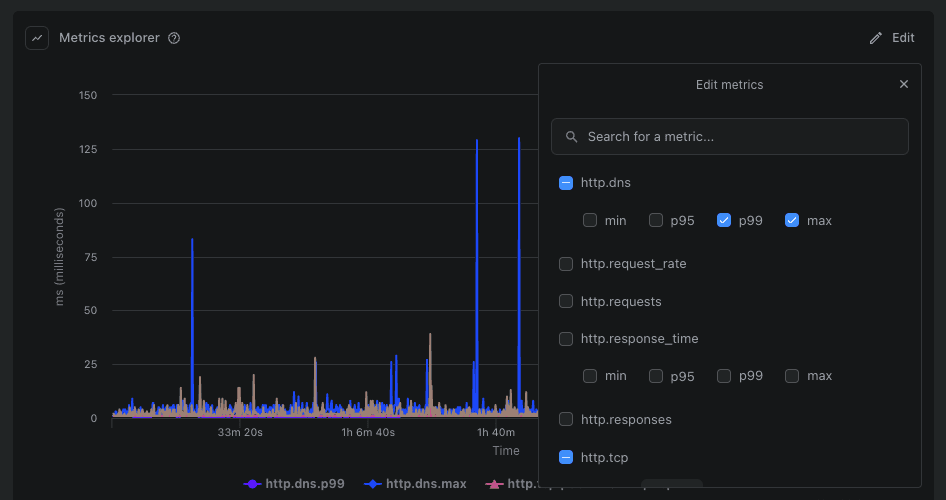
New “Metric Explorer” widget to let you chart and compare any metric (including custom metrics) generated by the test run
Fixes, Tweaks and Polish
Layout: tweaks to spacing across the board to increase information density and make more room for what matters. Improved layout of the main test list view and individual test views.
Charting: ability to combine multiple metrics on one chart
Charting: show combined tooltips for each point along the time axis
Fix for sidebar and main area overlapping at some screen sizes
Fix issue with flash messages disappearing from view
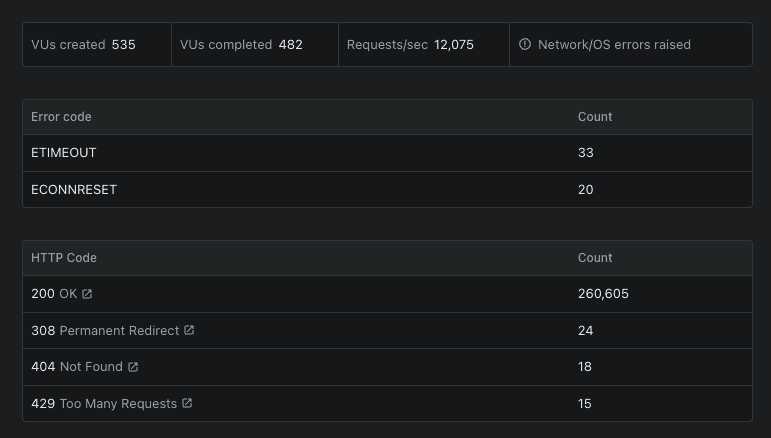
A summary view of all errors raised during the test (if any), such as request timeouts, dropped TCP connections etc.
A summary view of HTTP codes, HTTP request rate, and response time distribution (min, max, p999, p99, and p95).
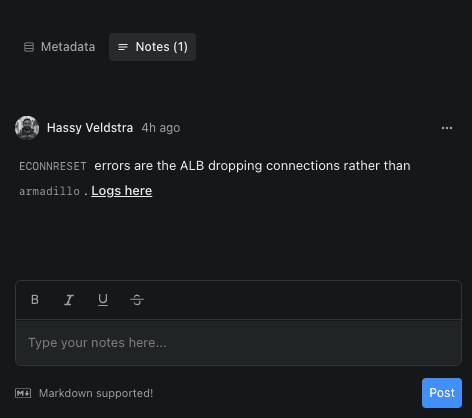
Notes
Capture the results of performance investigations and link to relevant external resources such as Datadog dashboards, Kibana logs, or JIRA tickets. With full Markdown support, and ability to post notes via the CLI.
Charting improvements
Color palette improvements to improve readability
Fixed an issue with displaying charts for tests that generate a lot of data, such as 8-12 hour long soak tests
Fixes to zooming and panning
Light mode
And finally, if dark mode isn’t your thing, the dashboard has a light mode now. Toggle it on via Profile -> Light Mode.
We have improved the layout and styling of reports generated with artillery report.
—dotenv flag
You can now load environment variables from a file with the --dotenv flag. Those env vars are available in Artillery scenarios through the $env variable.
Dashboard
Visual polish
Improved homepage responsiveness
Updated load test table with new context tags and new flexible tags
Updated context menus
Updated header styling in load test view.
New and improved selected tags filter bar
Show loading skeletons while data is being fetched
CDK installer
We released an official AWS CDK -based installer for Artillery dashboard.
The dashboard can now be deployed in more than one way to fit the exact requirements of your organization:
As an internal-facing, inside a VPC. This is the default deployment mode, and it will require an existing VPN setup to access the app. TLS is optional with this setup.
As a publig public-facing, which requires TLS with a pre-provisioned ACM certificate.
Custom domain may be configured on top of the provisioned ALB DNS name.
GitHub Authentication
We added support for authentication through GitHub.
A long requested feature of our dashboard has been the ability to login with GitHub. A layer of authentication removing the need for VPN’s on your end.
With the latest we’re shipping:
Authentication
Fixed a bug relating to Load Test table horizontal scroll.
Load tests now fail a little more gracefully with more robust checks for data.
Also improvement on empty states when a Load Test is firing up.
Artillery Probe
Added querying for XML/HTML responses with Cheerio
Kubectl
Latest release of Kubectl plugin is out now! Find it here .
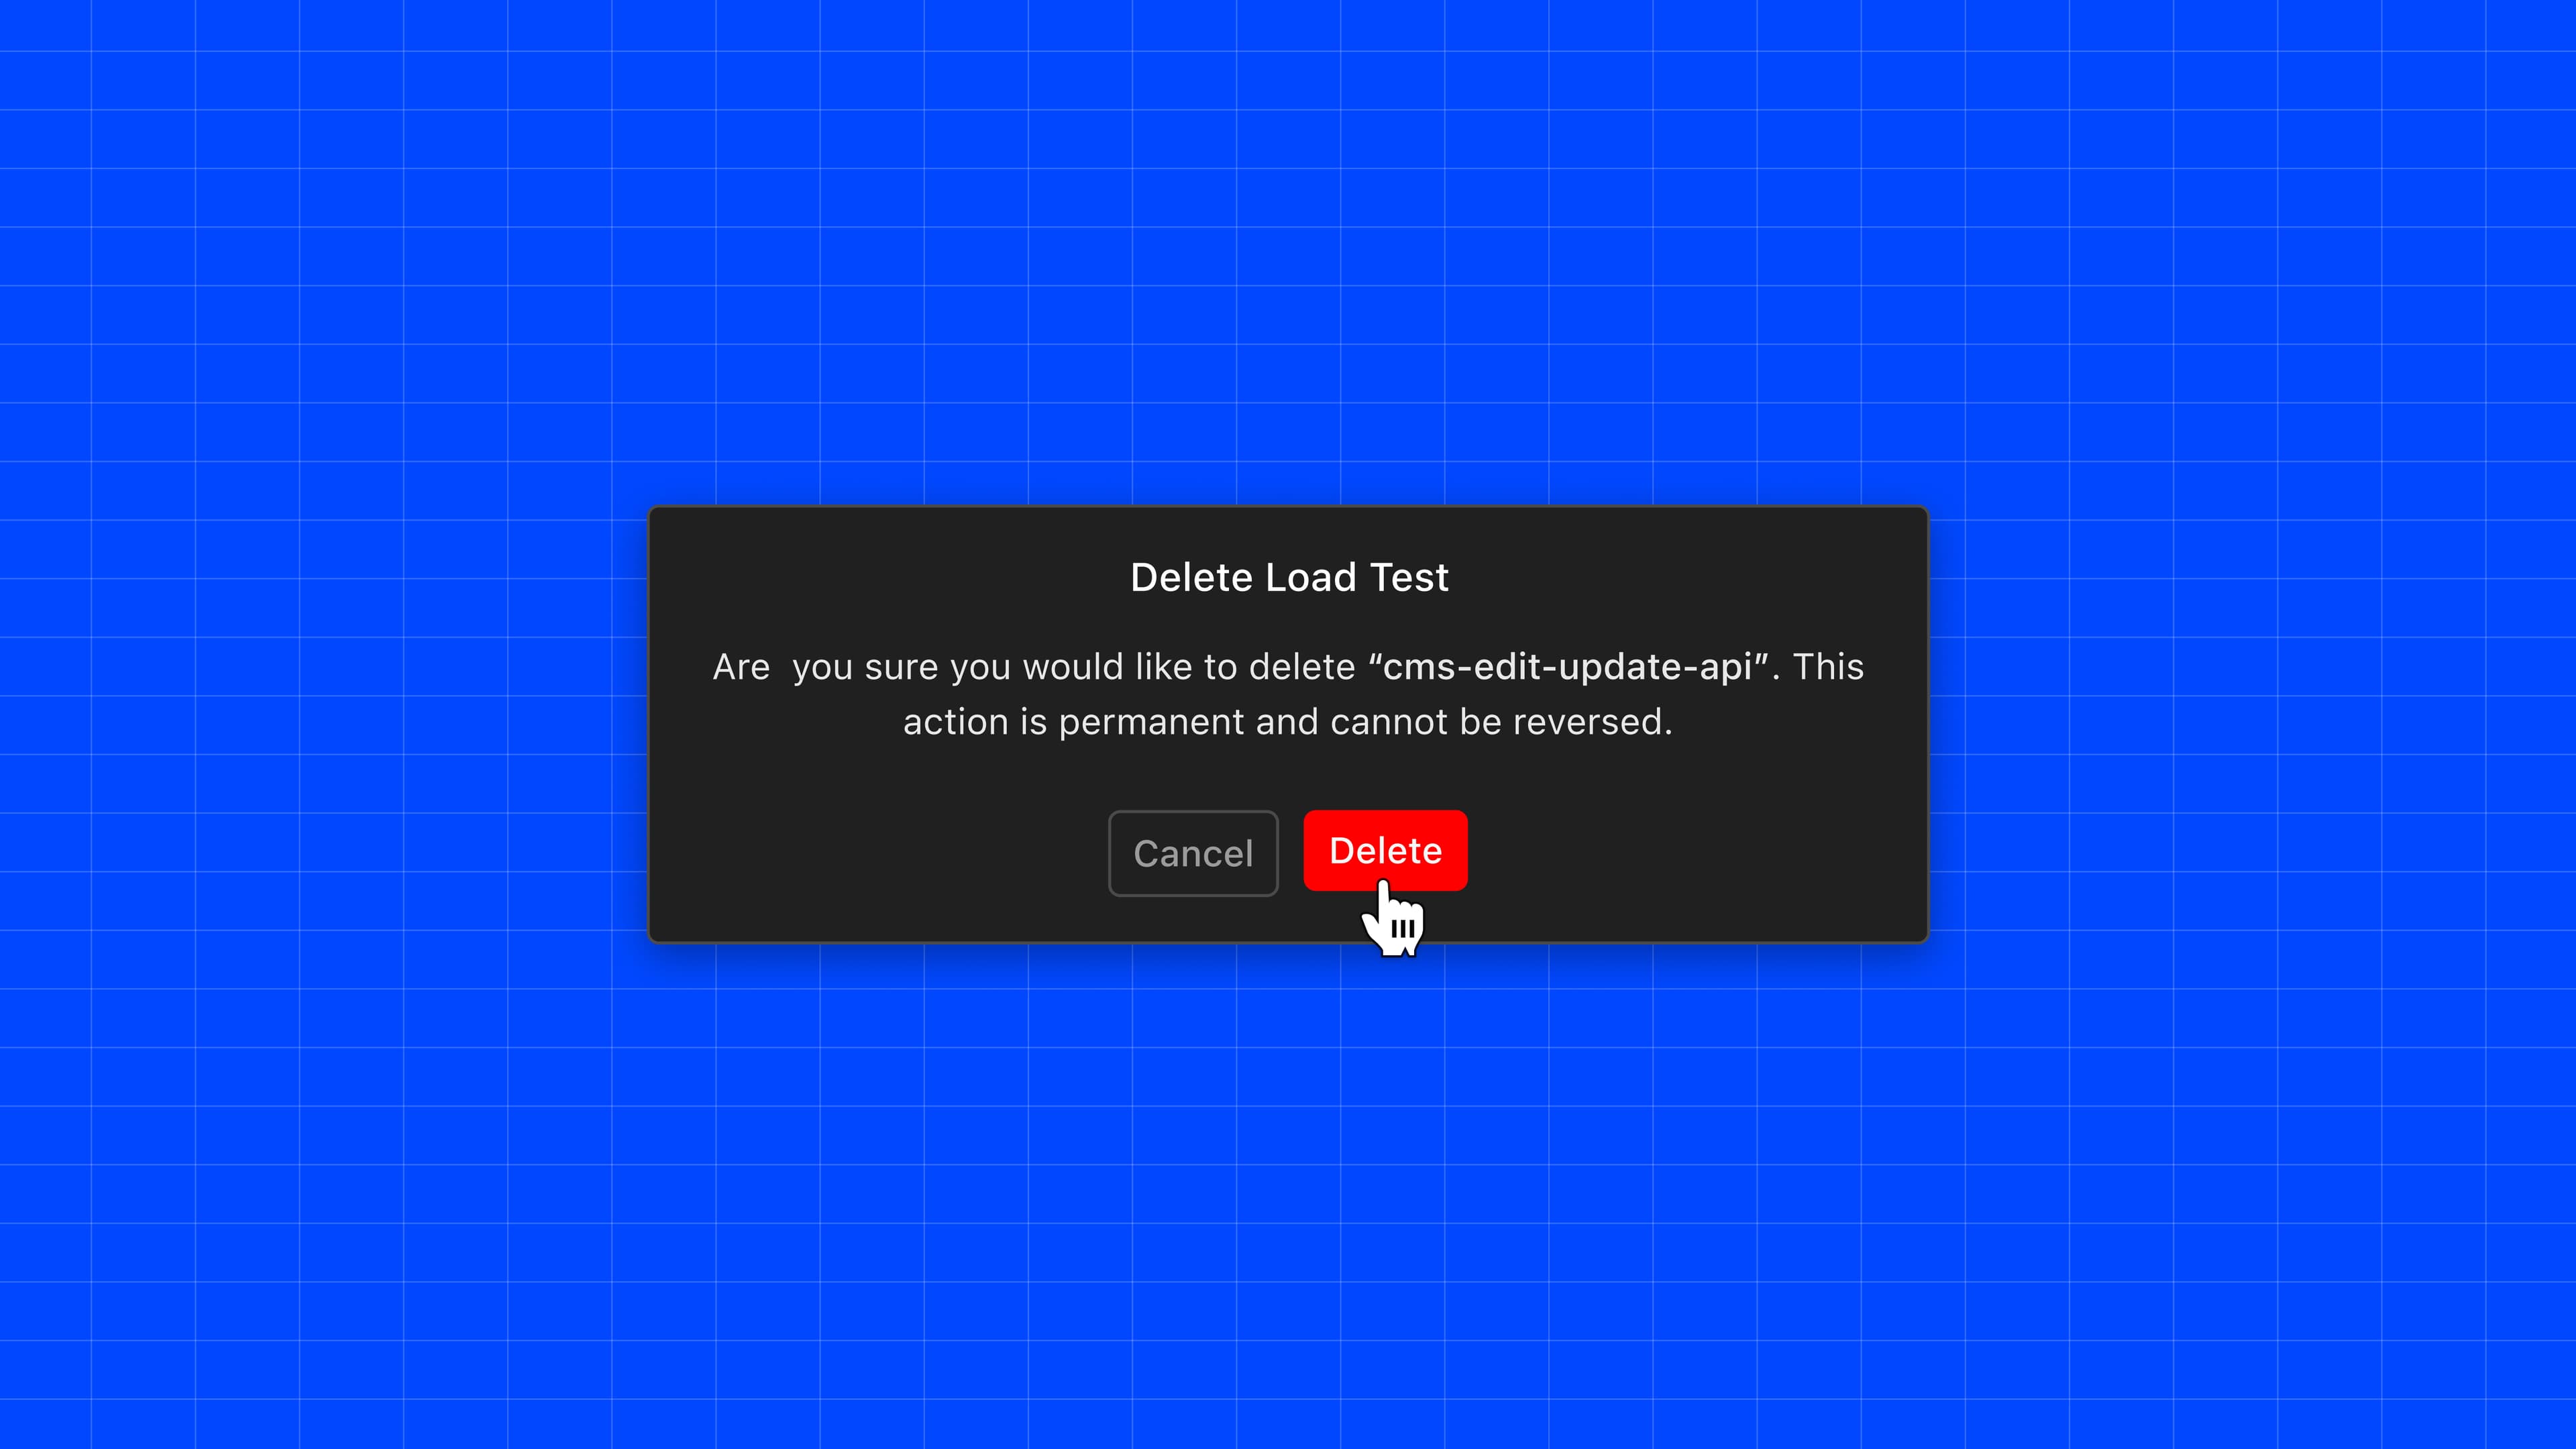
Sometimes you don’t need to keep a test result around - maybe the run did not complete and you don’t need the report, or perhaps you ran the test in the wrong environment and the results are meaningless. Whatever the reason, you can now delete test results you don’t need.
In case you missed it in the previous changelog, this can be done from the CLI too with the - Add delete-test-run command.
Artillery CLI
Artillery v2.0.0-13 has been released:
Fix issue with phase names sometimes not being printed
Add support for matching multiple headers with the same name in the expectations plugin (see an example in the docs)
(Artillery Pro Dashboard is in early beta with a small number of Artillery Pro customers. If you’d like to join the beta, please let us know via team@artillery.io
)
Last week we made a few changes focused on improving querying & filtering, providing more context around test run data, and adding a bit of extra polish.
More powerful filtering
You can now search & filter by:
tags
date range
status
or a combination of the above
We also improved the tag filtering input and made tag filter query easier to read.
Customize main load test view
You can now customize the columns shown in the main load test view to be able to find what you’re looking for faster.
More test metadata
We’ve exposed more metadata for test runs in the sidebar. You can now see more information for each test run now, such as:
Full artillery command used to trigger the test run
CPU and memory configuration for the workers
Version information for Artillery CLI used to trigger the test
Names of secrets used by the test run
Progress indicators
Sometimes filtering and searching can take a bit of time, especially for more complex queries. We’ve added loading indicators in a few places to make it clear that the UI is busy doing the thing you asked it to do.
Fixes
Fixed bug which would cause the view to scroll to the top when viewing Notes
Fixed “Finished at” time being shown incorrectly for tests which are in progress
Welcome to our brand new changelog where we will keep you updated on new releases, features, fixes and improvements in our products.
Artillery Pro Dashboard
Searching & Filtering
You can now filter the list of load test results by multiple tags.
You can further refine a tag filter with test status. For example to show all test runs tagged with team:sre and service:checkout-service which did not complete successfully.
Chart navigation
You can now jump straight to a chart for a specific metric from the sidebar.
Zooming and panning
We added support for zooming and panning to metric charts.
Update notifications
When a new release of the dashboard is available, the app will show a notification in the top-right corner, along with a link to the changelog and upgrade instructions.
Kubernetes Support
We have released an early preview of the Artillery Operator for Kubernetes. The goal of the project is to make Kubernetes-specific workflows easier with Artillery. We’d love to hear your feedback, comments, and suggestions.