Changelog
Updates and changes from the Artillery team.
We have significantly improved the performance of load test reports for tests with many distinct metrics: memory consumption was reduced, Text logs and Activity widgets open much faster, and the Chart builder widget can now handle thousands of metrics.
Tooltips are now synchronized across visible charts making it easier to compare metrics. We also improved the tooltip design and tweaked chart legends to take less space on the page, further improving the readability of reports.
We have added a new option under the test view more menu (…) so you can now export test reports as PDF.
- Add search functionality to Text log widget
- Add loading state to Metrics page
- Add missing empty state to Apdex widget
- Fix chart navigator not showing reliably across different charts
- Fix charts having incorrect zoom level on page load
- Fix some dates not showing correctly when using UTC
Contextual docs & help are now available right inside Artillery Cloud via the new info side panel:
- Explanations of features
- Usage guides
- Relevant CLI commands
- Code snippets
You can now see trends across multiple runs of a load test in the new Performance Trends view in Artillery Cloud.
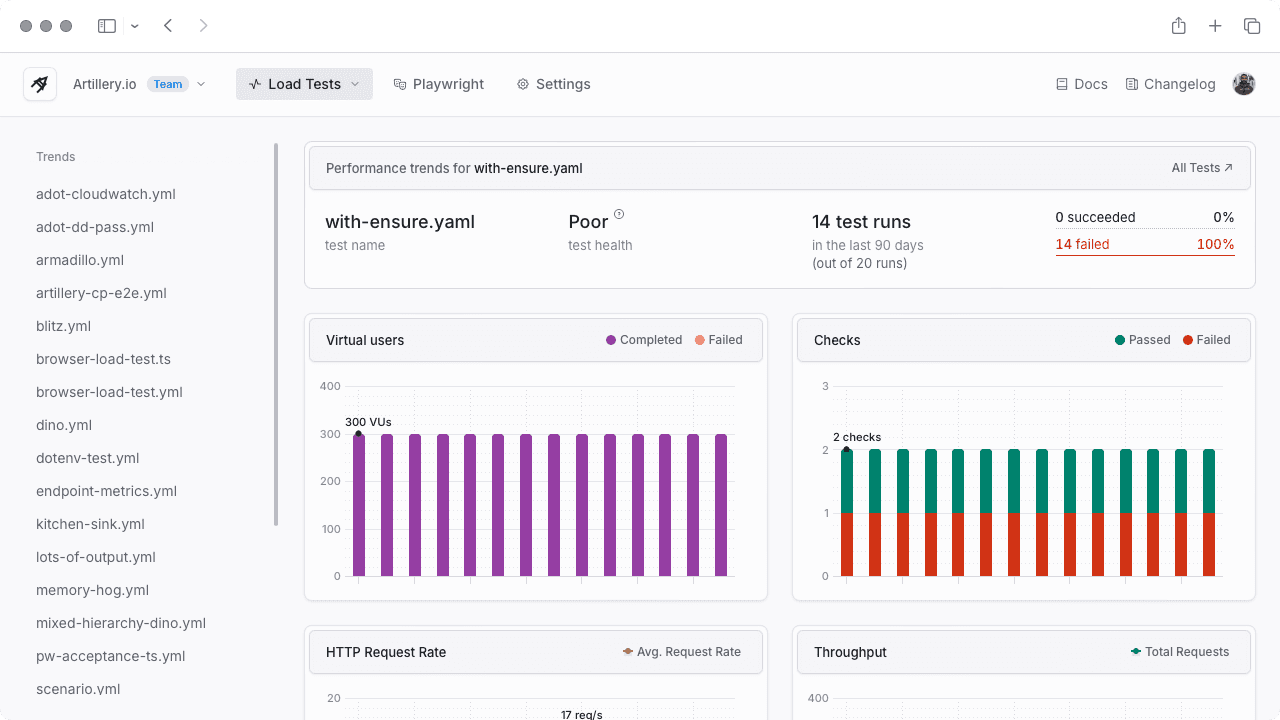
Performance Trends view provides a summary of test health, and changes across key metrics in a test:
- The number of virtual users (VUs), with a breakdown for successful/failed VUs
- Pass/fail breakdown of , if defined
- HTTP request rate and throughput
- HTTP response time (p95 and p99)
- Test duration
Trends are calculated automatically for all load test runs, and are grouped by test name.
To see trends for a load test, you need to have at least 10 distinct runs of that test in the previous 90 days.
Performance Trends are available to all users on Team, Business, and Enterprise plans. There is no additional cost for using Performance Trends.
We’ve rebuilt Playwright Test Runner reporting in Artillery Cloud from the ground up with a focus on performance and usability.
Playwright test reports now update in real-time as a test is running, and you can start investigating test failures as soon as they happen.
Traces, screenshots, and other attachments are available for each test case immediately, and can be viewed directly in the report.
You can create a sharing URL with the Share button to share reports with people outside of your Artillery Cloud organization.
metrics can be captured and reported for every page in your tests automatically.
This feature needs to be enabled in your tests - see the for more informaion.
Playwright v1.51.0 and later automatically attaches a prompt with useful context for every failing test case. You can copy that prompt with the “Copy prompt” button in the report and in the trace viewer.
This feature requires Playwright v1.52 or later.
The report will show the details of the Git commit if is enabled in your file (see for details).

Edmundo Santos
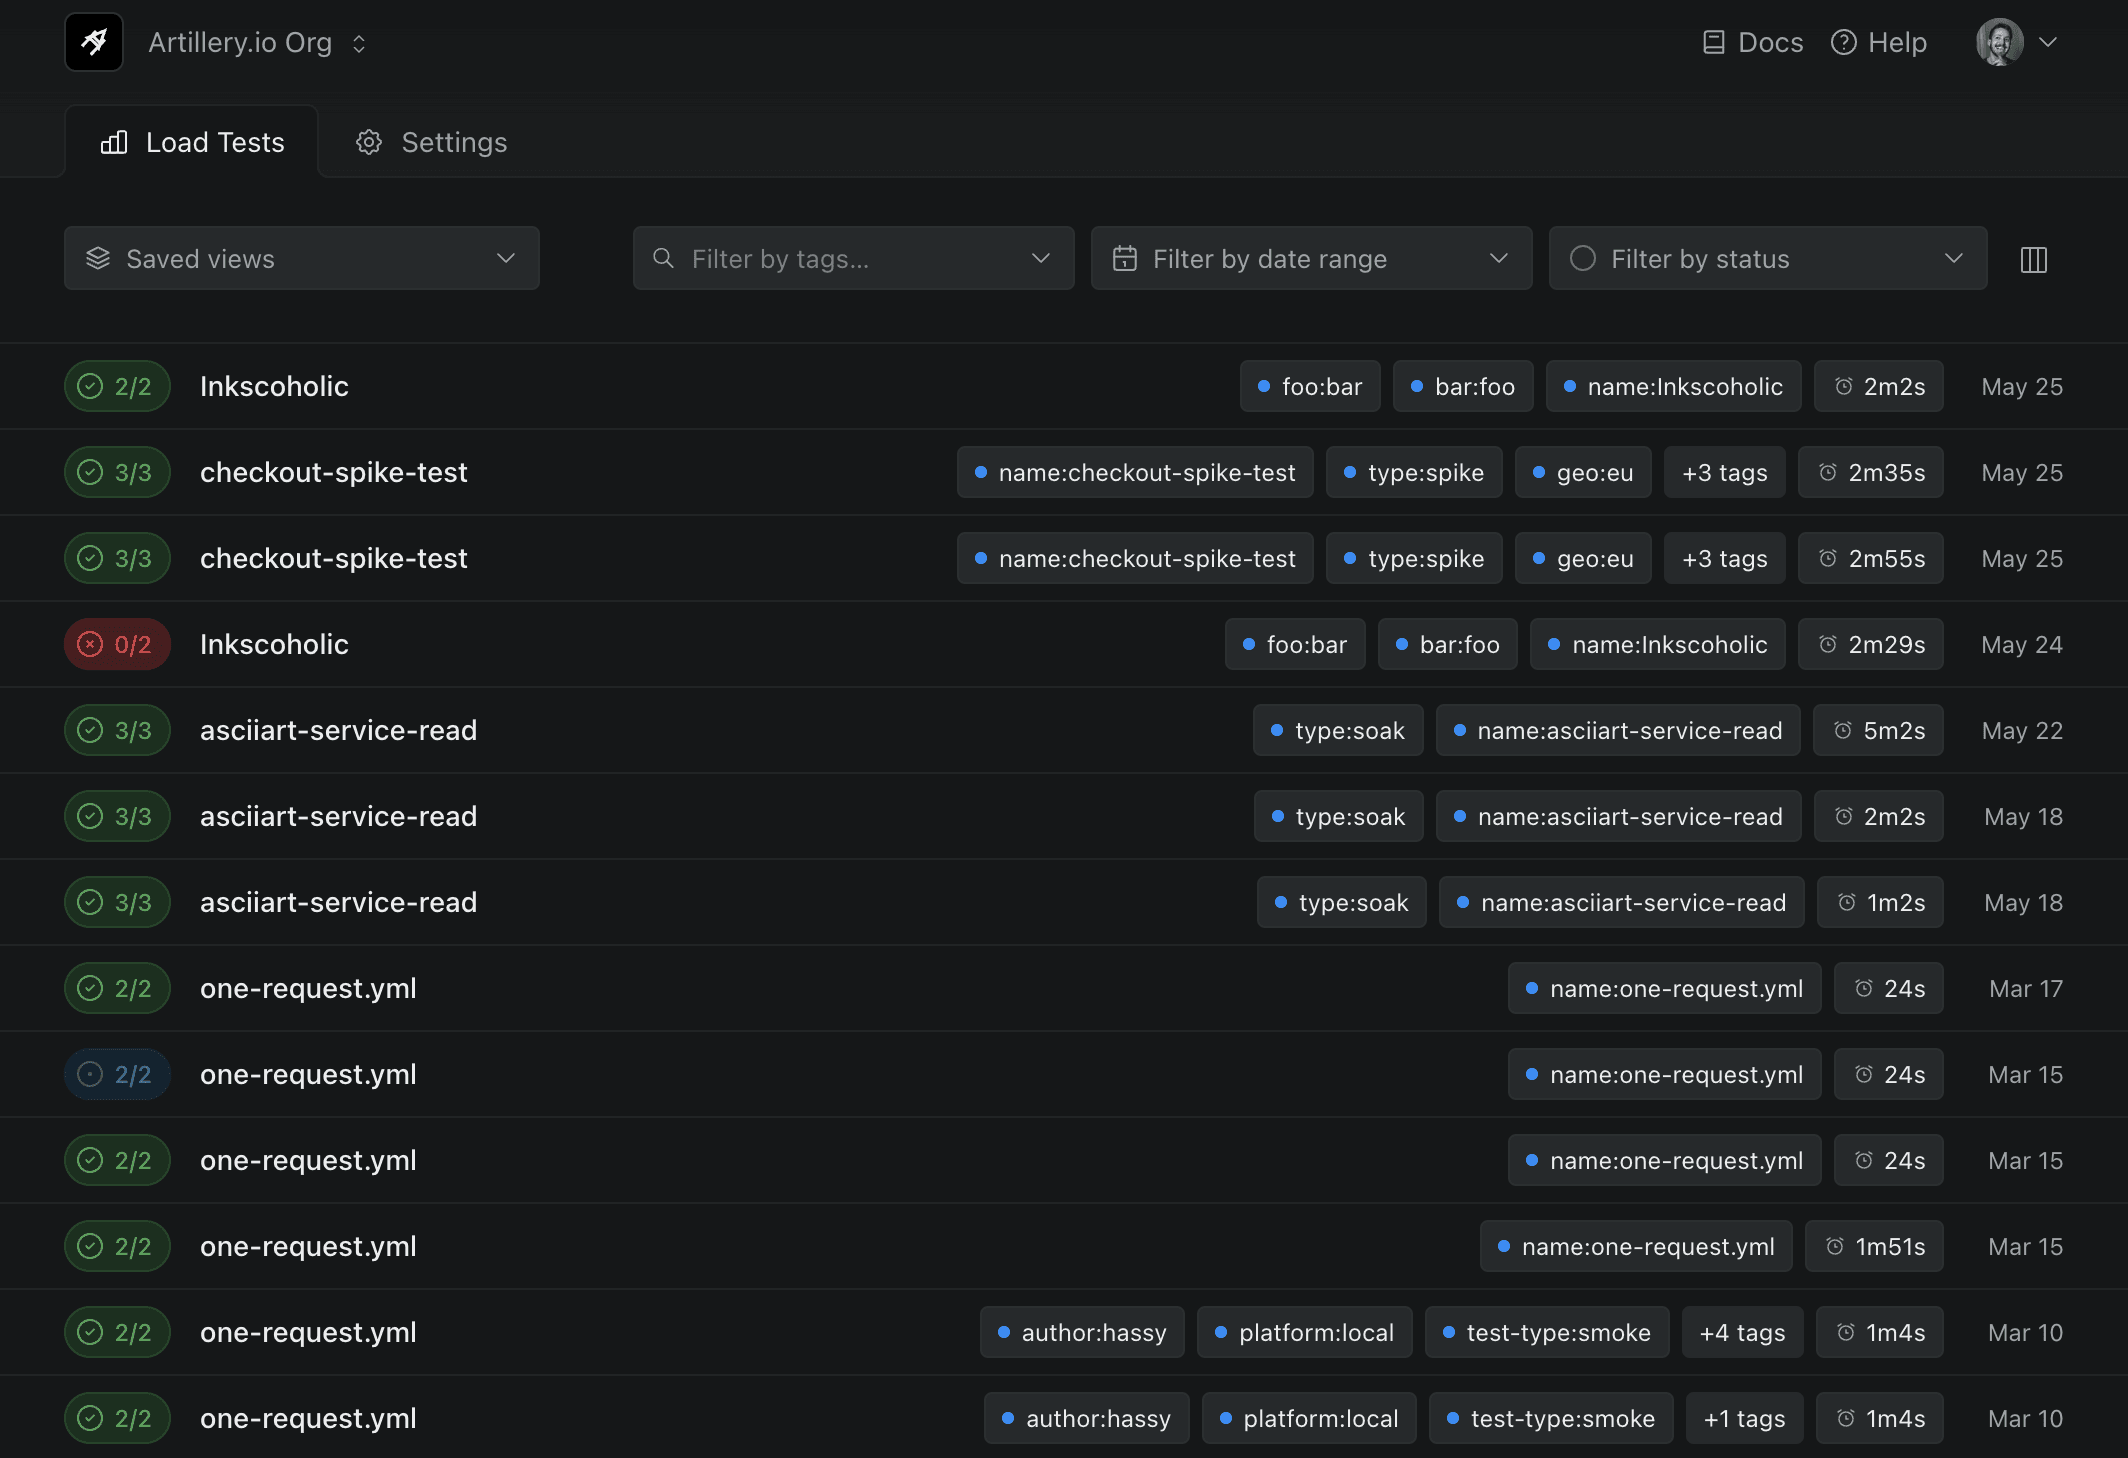
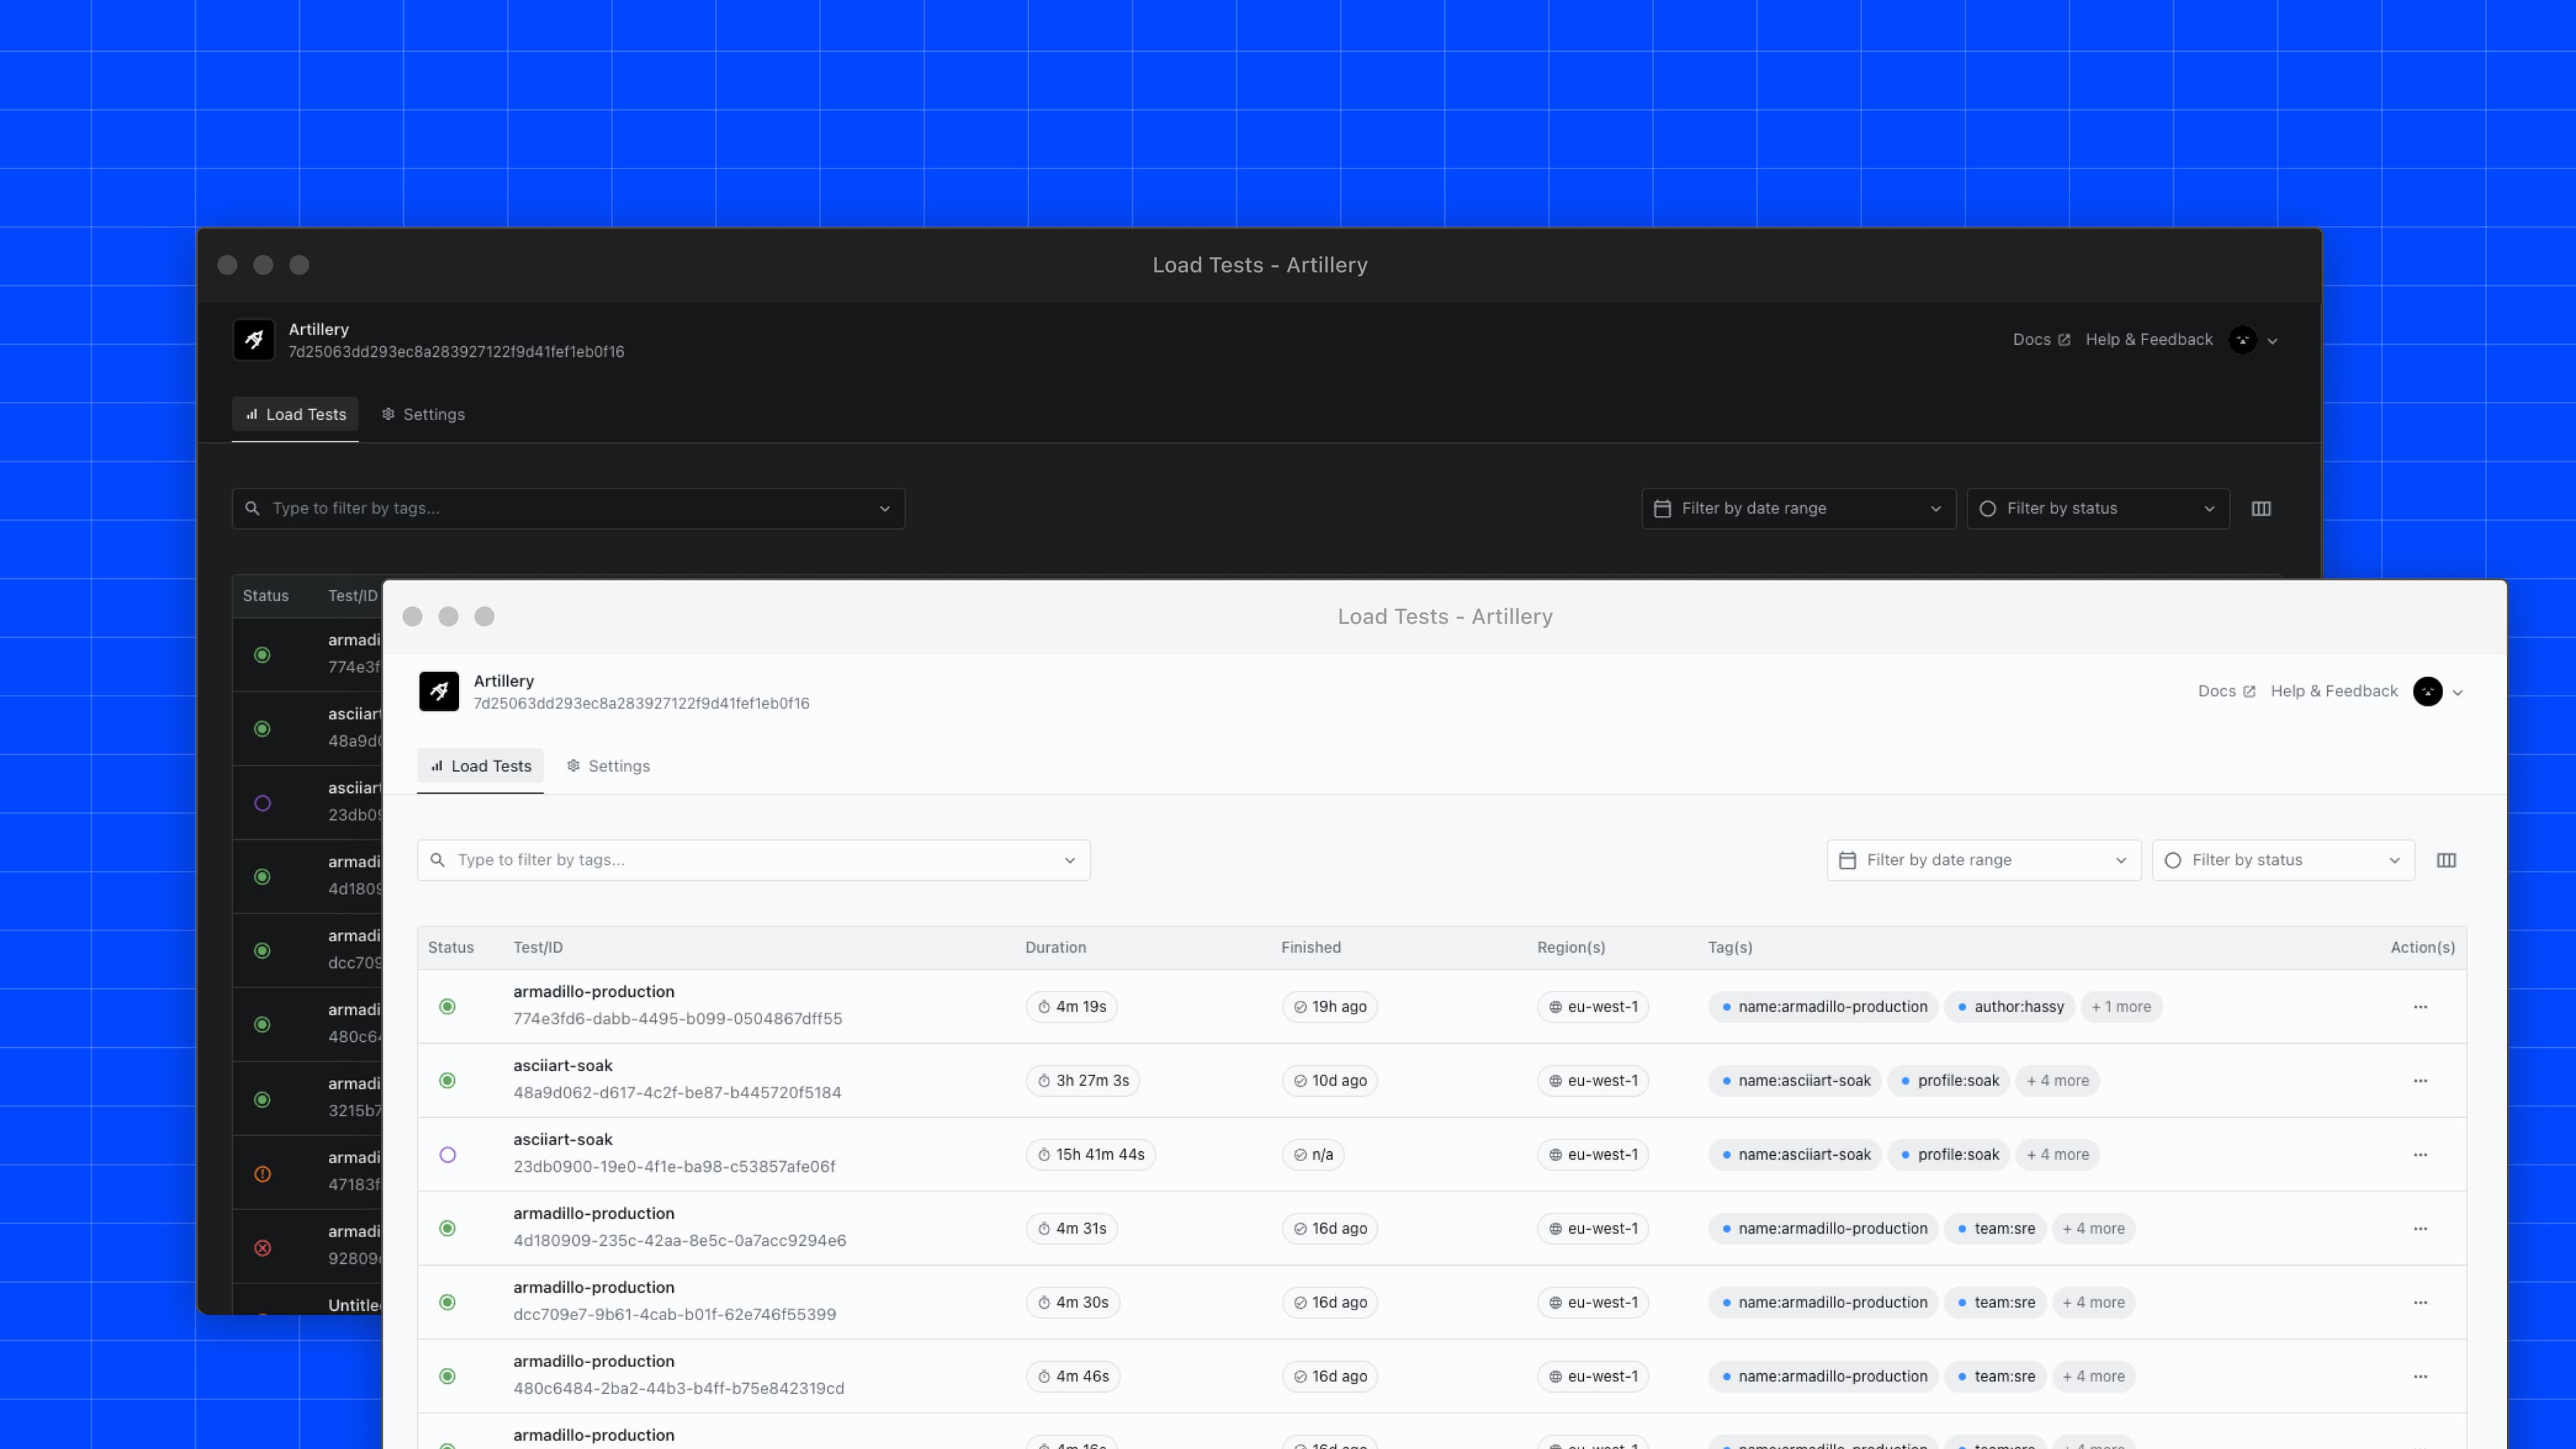
Introducing a new way to filter and organize your tests. We have updated the UI to better surface all filters and added even more options to filter by, so it should be easy to find specific test runs.
- New filters: test name, platform, user, tests with notes, and shared tests
- UI is now fully keyboard accessible
- Improve search functionality for test names and tags
- Filters can be saved as Views for easy access and faster team collaboration
- Added new filters to Comparison view so you can quickly find tests to compare
- Compare tests that have different names
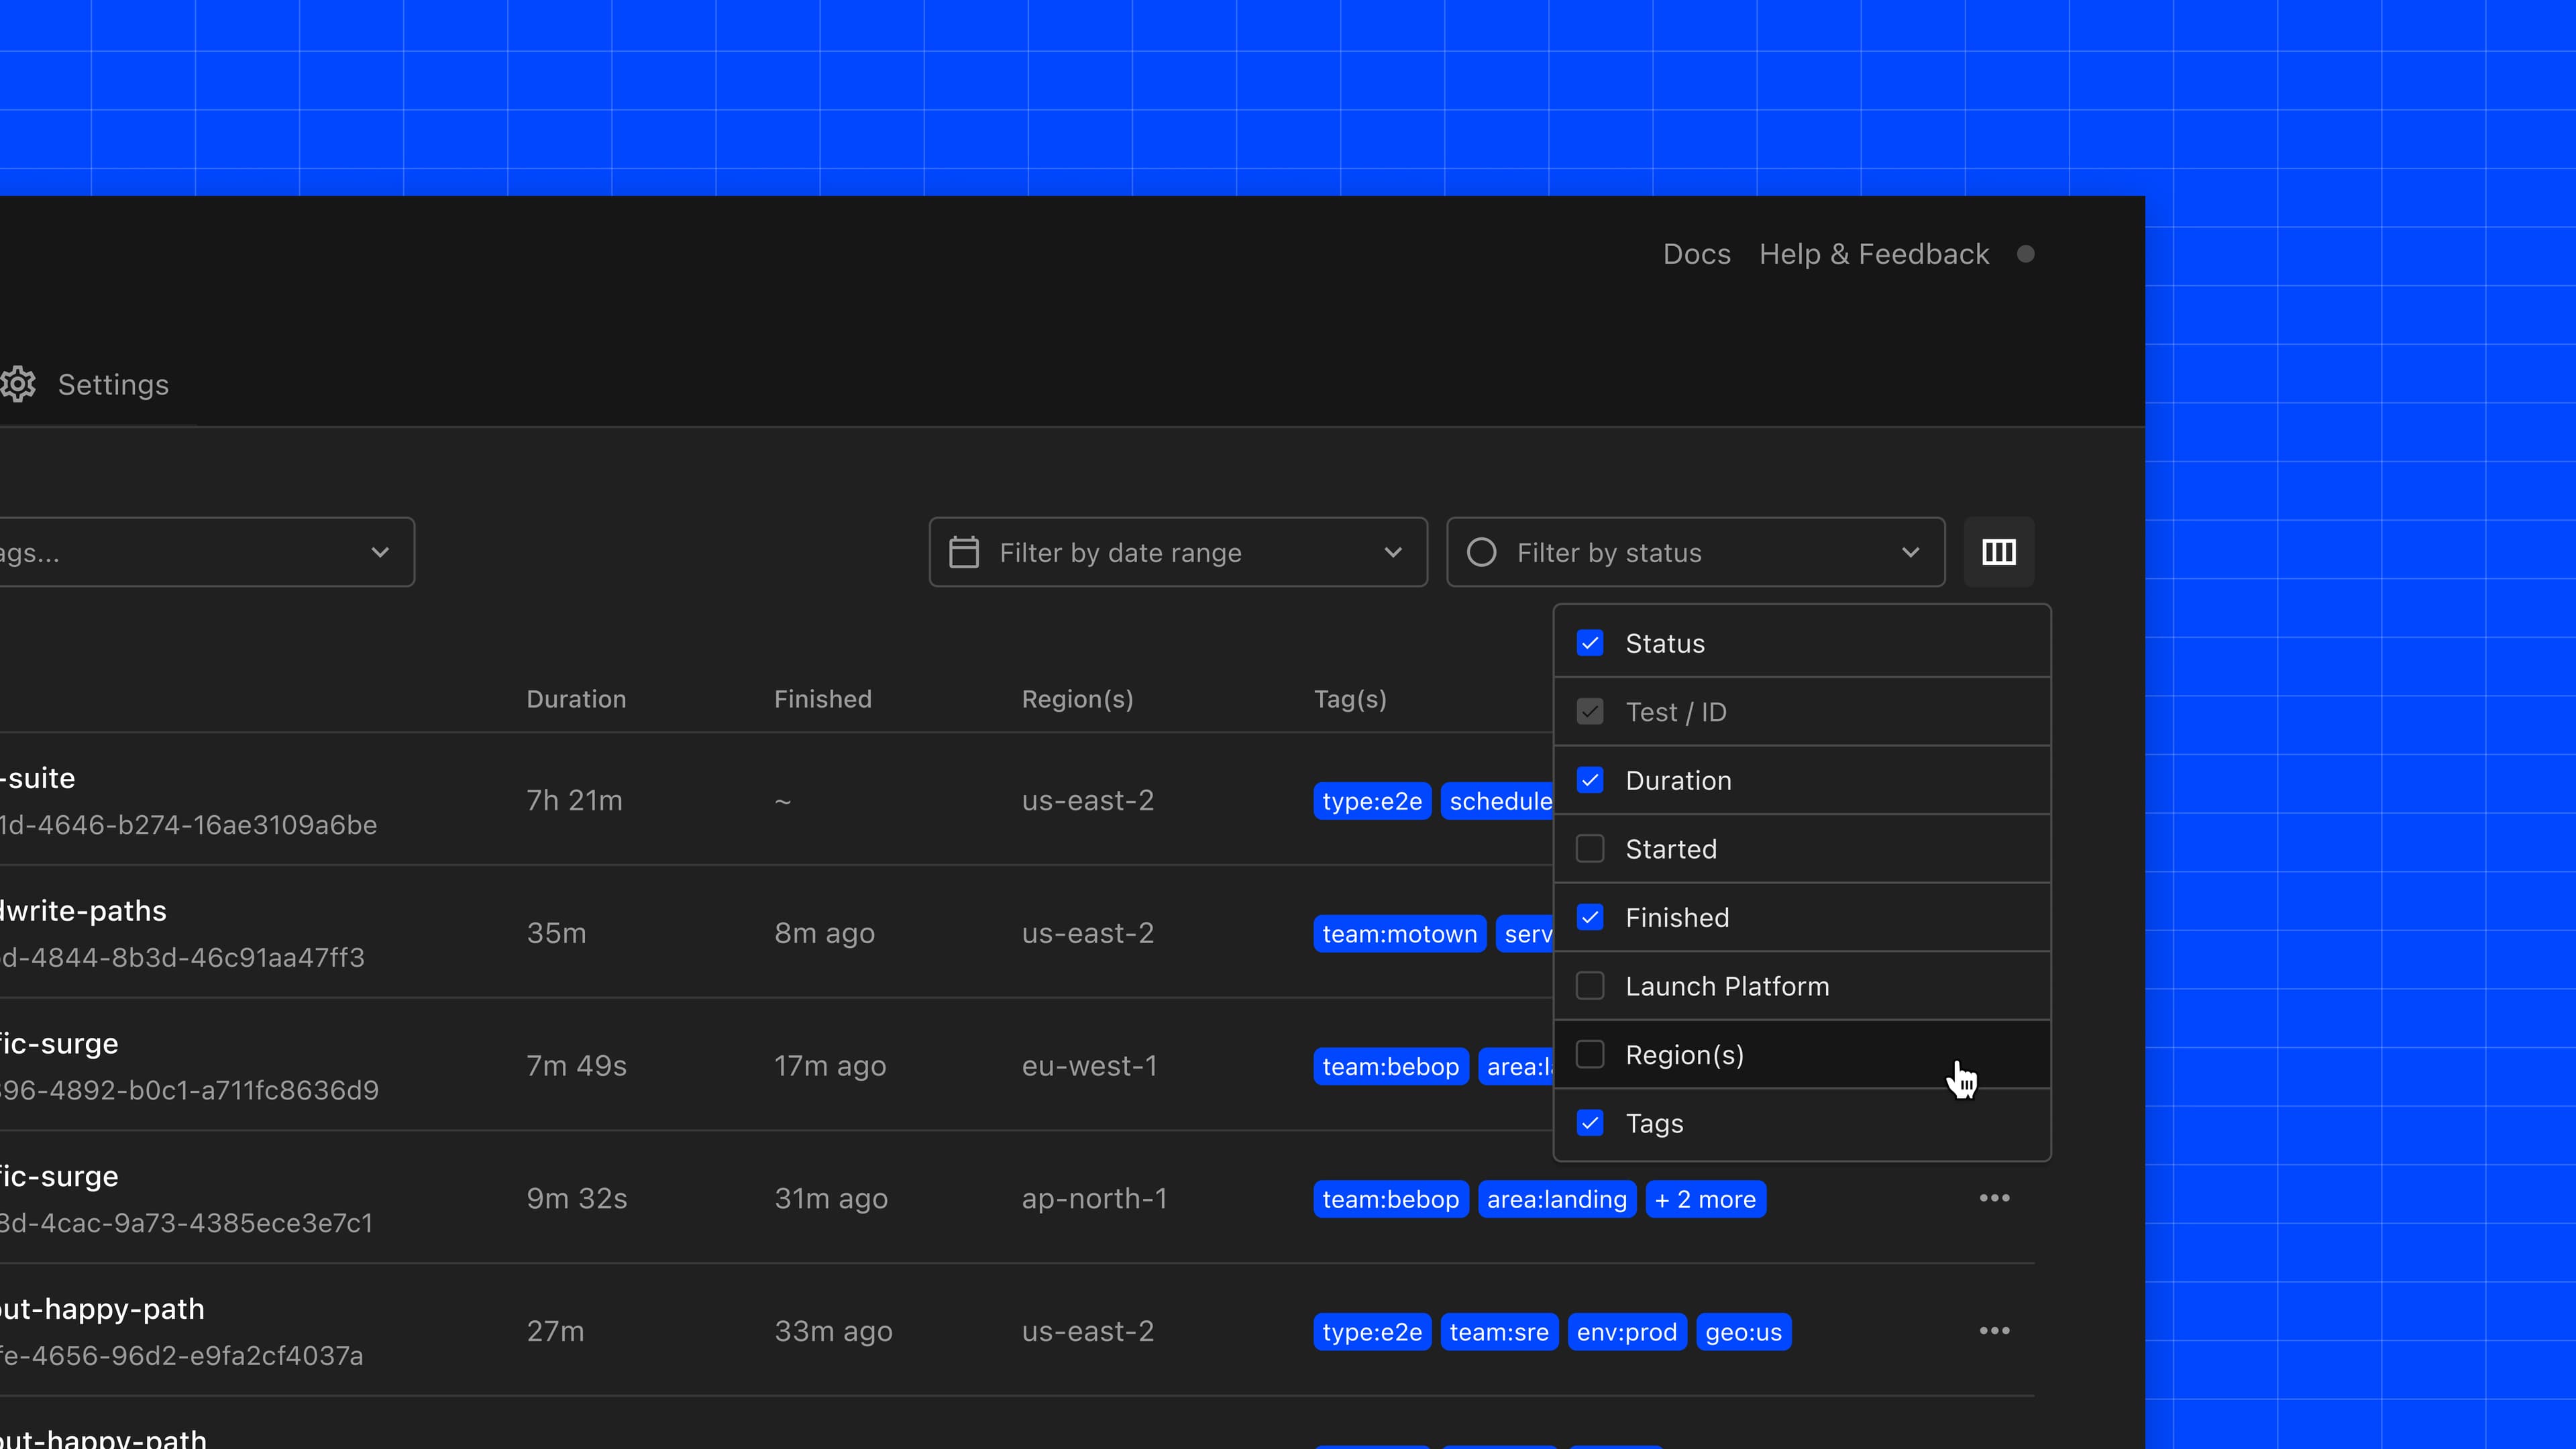
- Toggle what properties are displayed on the test list with the Display dropdown
- Use Views to quickly get back to previous saved filters
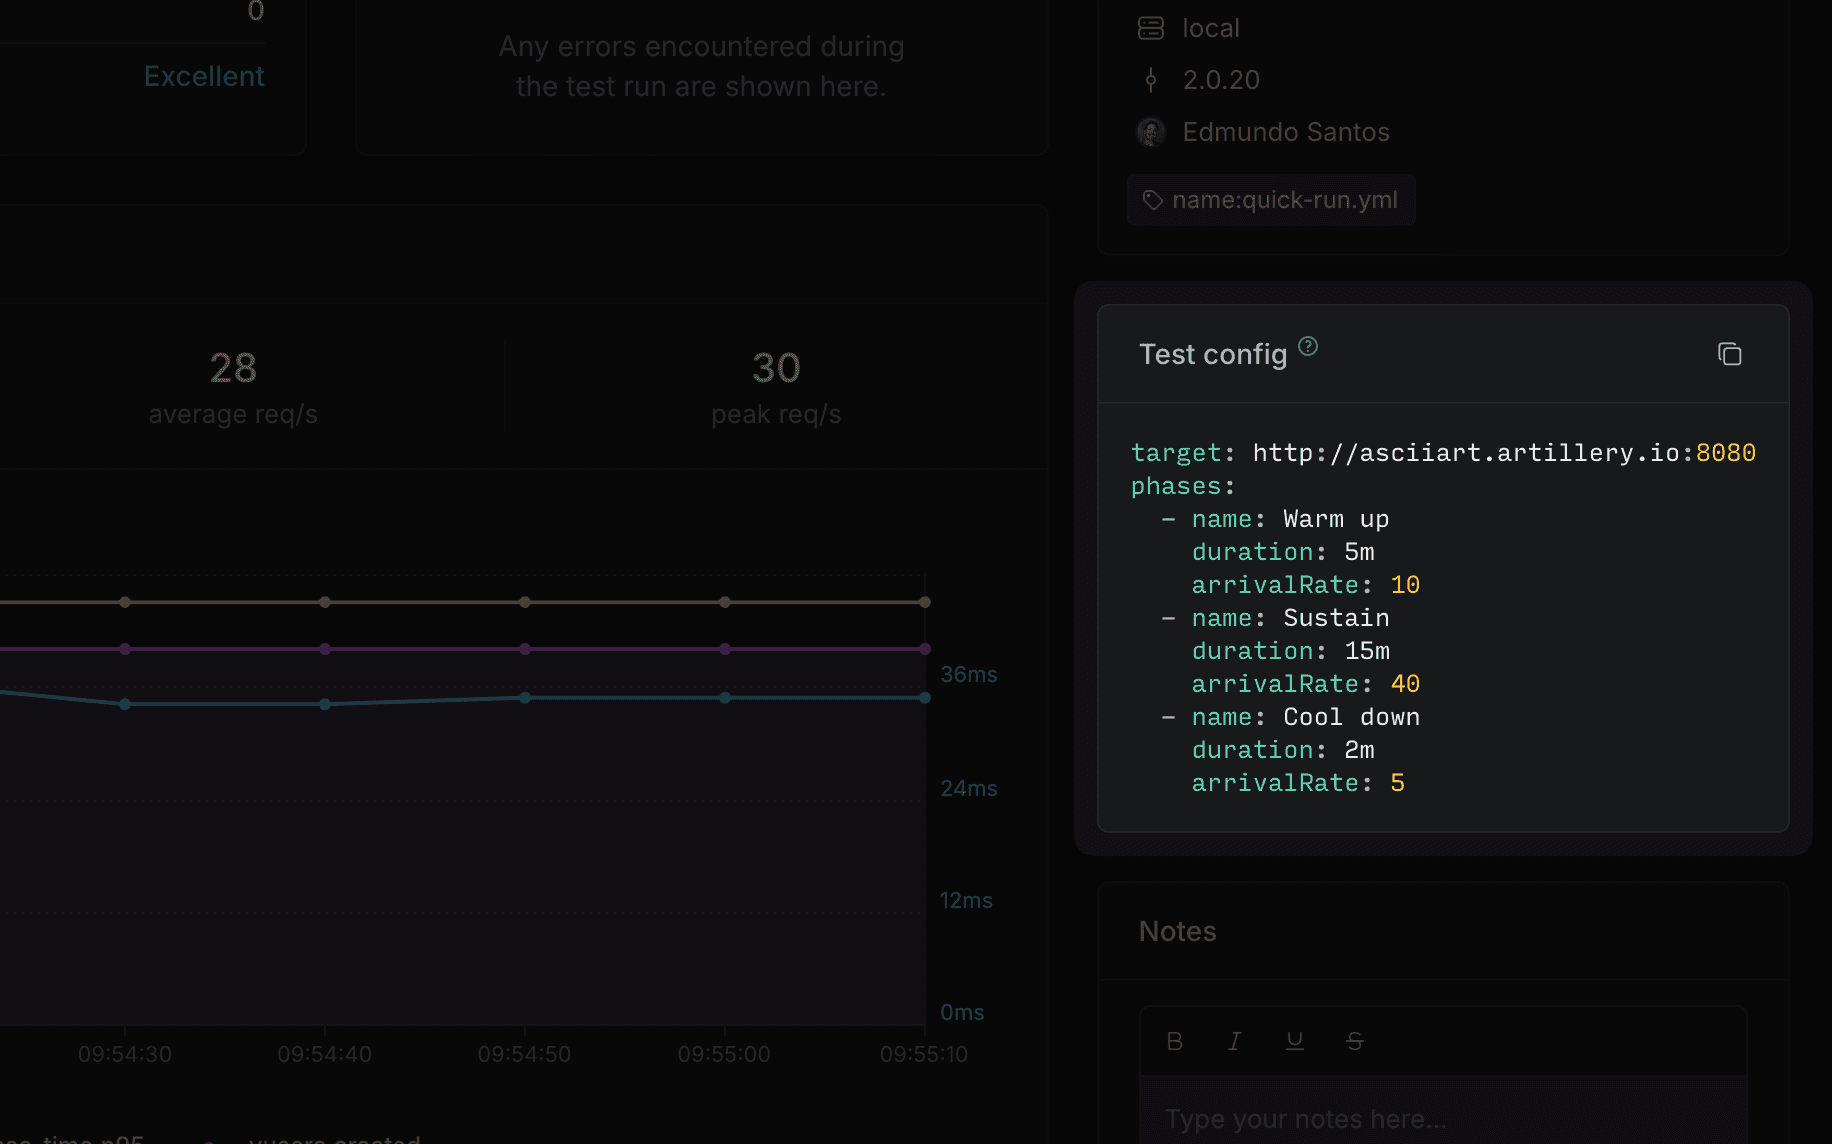
You can now see the and of your test right from the load test view — added in Artillery CLI v2.0.20.
Edmundo Santos
- Highlighted hovered widget pair in the Comparison view
- Show test run status for each test run in the Comparison view
- Fix widgets not resizing correctly when comparing test runs
- Remove unnecessary chart animations when toggling the Comparison view
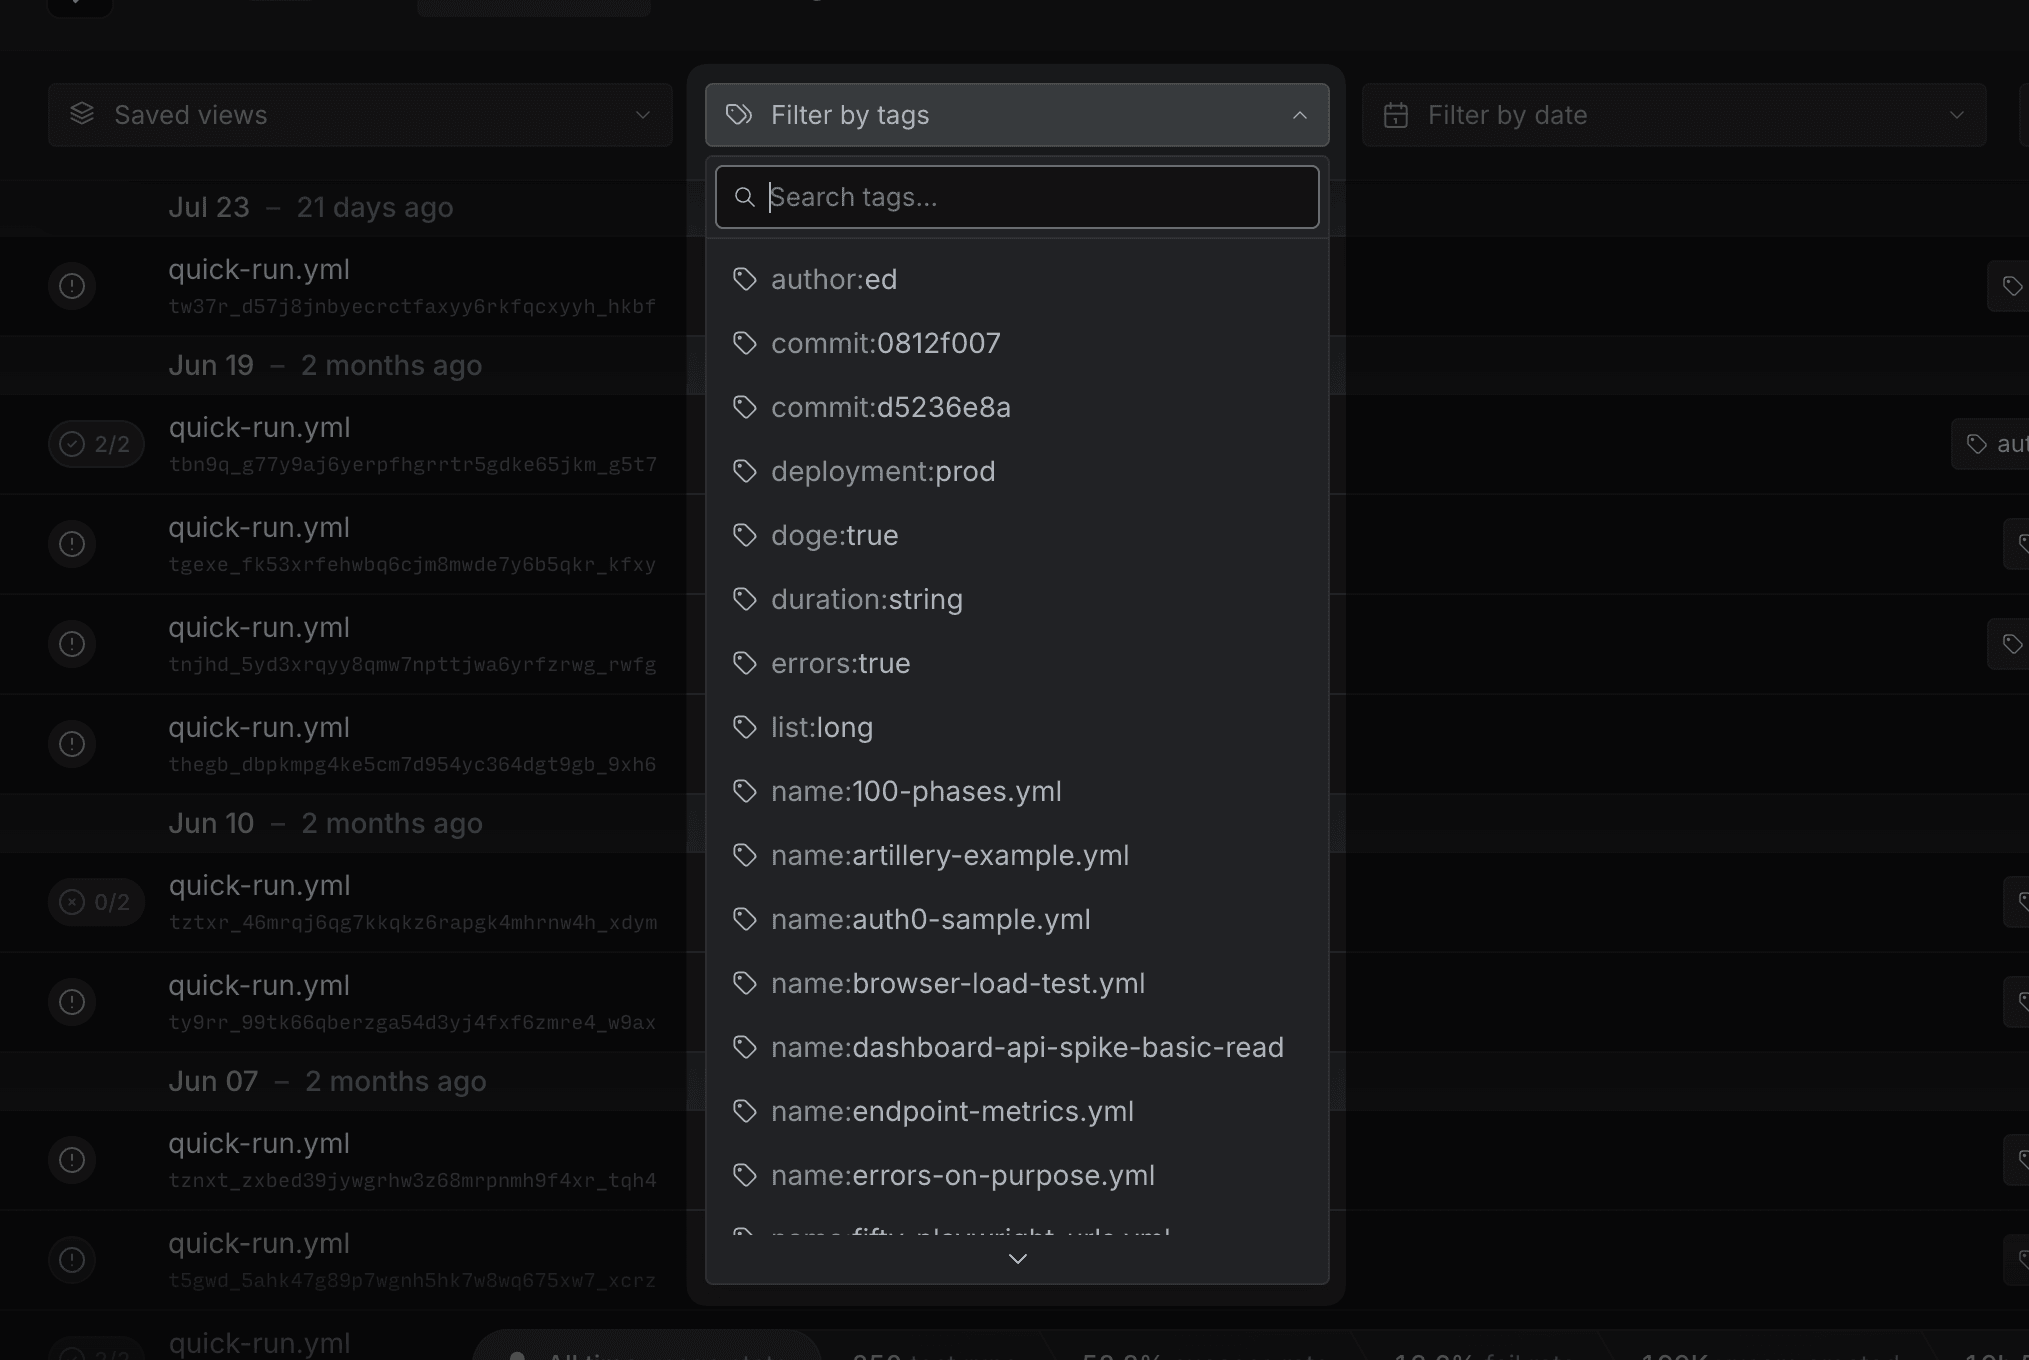
- Introduce the ability to search tags by name
- Dropdown loads much faster, and Teams that use thousands of tags will see a significant performance improvement as tag results are now paginated
- The tags dropdown takes all screen space available to show more tags at once
- Display an arrow icon if tags overflows the dropdown viewport
Edmundo Santos
You can now try our new Comparison view. This feature lets you to compare two test runs side by side, making it easier to spot trends and correlations between them. Right now the feature is in open preview for all users, so try it out and let us know what you think.
- Improve performance when creating custom charts and adding notes
- Add pagination to HTTP and Page performance widgets if more than 10 results are available
- Fix a bug with the tooltip on HTTP requests chart would not display correctly
- Improve performance for Chart builder widget and Metrics page navigation for tests with many metrics
- Improve Notes widget responsiveness on smaller screens
Edmundo Santos
We have improved the Metrics page, it should load much faster and be easier and quicker to navigate. Here are the changes:
- Improve formatting of groups on metrics navigation
- Show load shape for each metric on the list
- Improve performance by only loading charts when they are visible
- Fix a bug with some Playwright tests not rendering on Firefox
- Sort organizations by name on the organization dropdown
- Improve behavior and spacing of components on shared test pages
Edmundo Santos
You can now create custom charts with any metrics from your test run. Charts created with the new chart builder are available across different test runs with the same name. Custom charts can also be viewed by other members of your team.
For long test runs, a navigator is available to help you zoom-in and inspect different phases of your load test. The new navigator is available on the bottom of the chart, and the zoom level is synchronized across all charts, including the newly introduced custom charts.
- Show full metric name on all charts
- Improve metric units formatting on all charts
- Fix issue with long metric names overflowing widgets and breaking some charts
Edmundo Santos
You can now invite new team members and manage existing membership from one screen.
See usage stats and limits
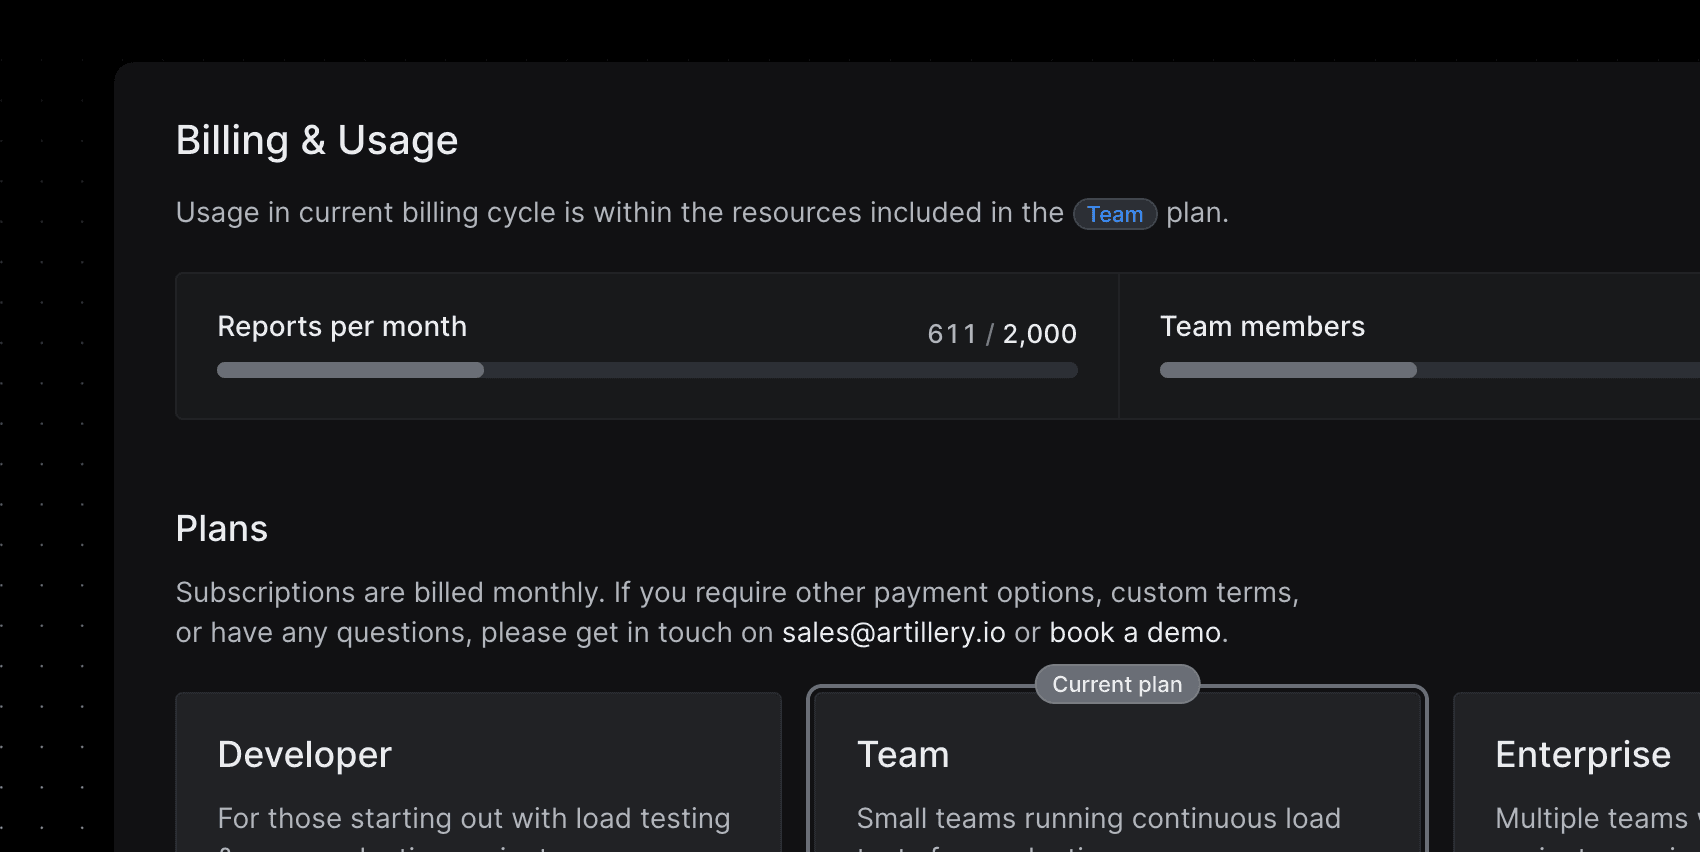
You can see how much of your plan’s quota your organization is using in the new usage stats section in the Billing page. There’s also a new FAQ section to help with any questions you might have around usage limits.
Filter by date gets a new navigation, with improvements for selecting dates across multiple months. There’s a new Last 7 days shortcut too.
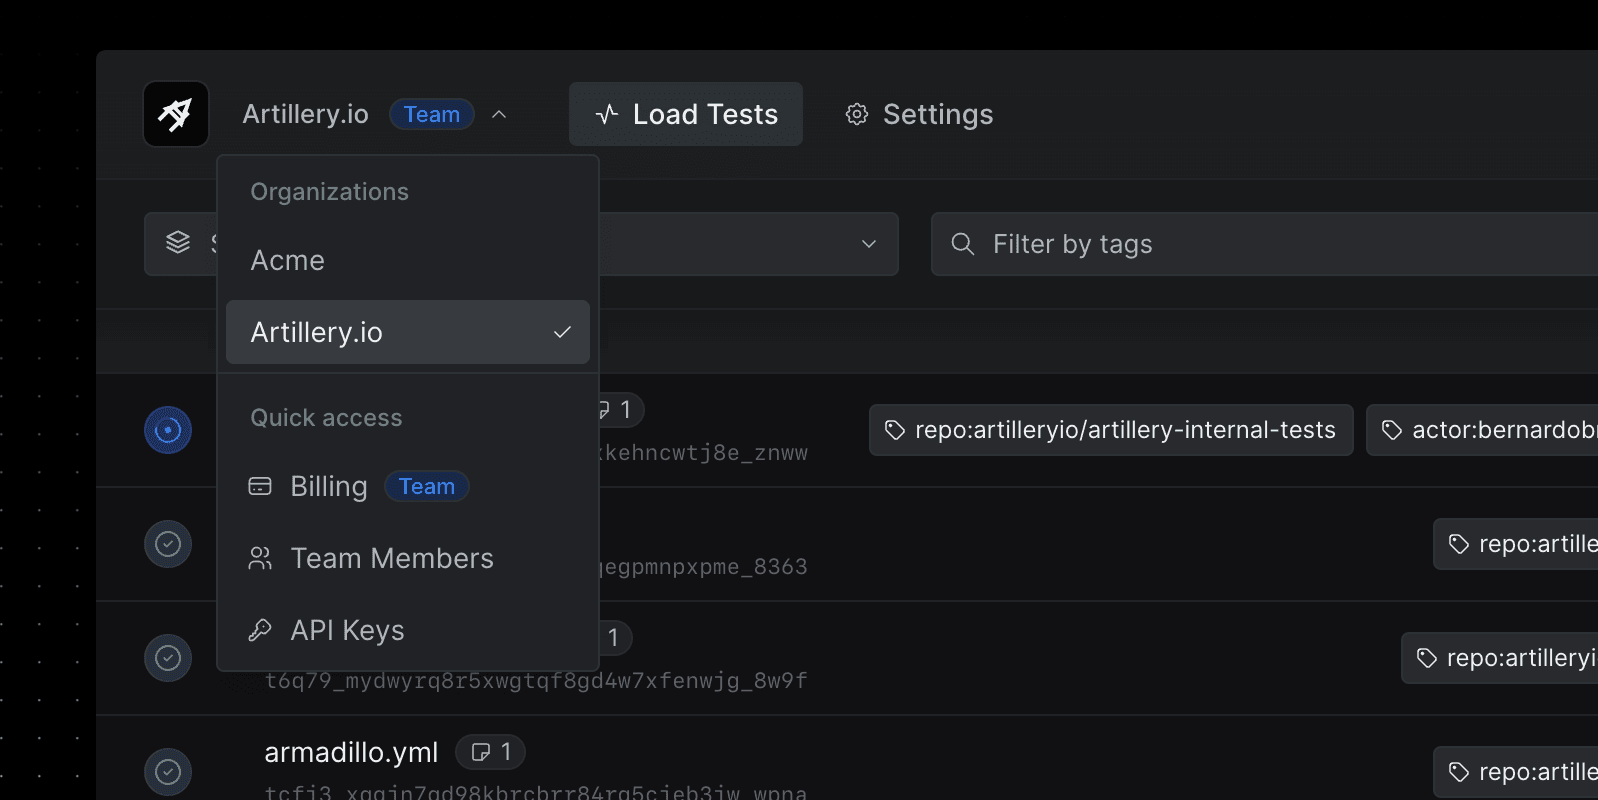
There’s a new quick access area with links to Billing, Team Members, and API Keys in the organization dropdown. You can now see your current billing plan too.
- Add support for displaying web vital — available when using
- Improve web vital metric comparison between different URLs
- Show on Page performance charts
- Move navigation to the right side of the page to match Overview page layout
- Fix charts not aligning on top of the page when navigating to report
- Charts now have the same width as the Load test Overview page
- Fix label overlapping columns on HTTP response distribution chart
- Fix load phase labels clipping on chart edges
- Improve Y Axis label formatting for all charts
Bug fixes and improvements
- Improve Dialogs and Modals design and add keyboard shortcut to close them
- Improve settings navigation on small screens
- Improve loading speed of the Load Test page
- Improve code snippets formatting on test notes
- Improve Load Tests Notes indication: much more visible and easier to spot what tests have notes
- Fix “Add note” having a line-break on some screen sizes
- Fix missing data labels on HTTP performance chart
Unique sharing URLs can now be generated for test reports. This is useful for sharing test reports with people outside of your team on Artillery Cloud.
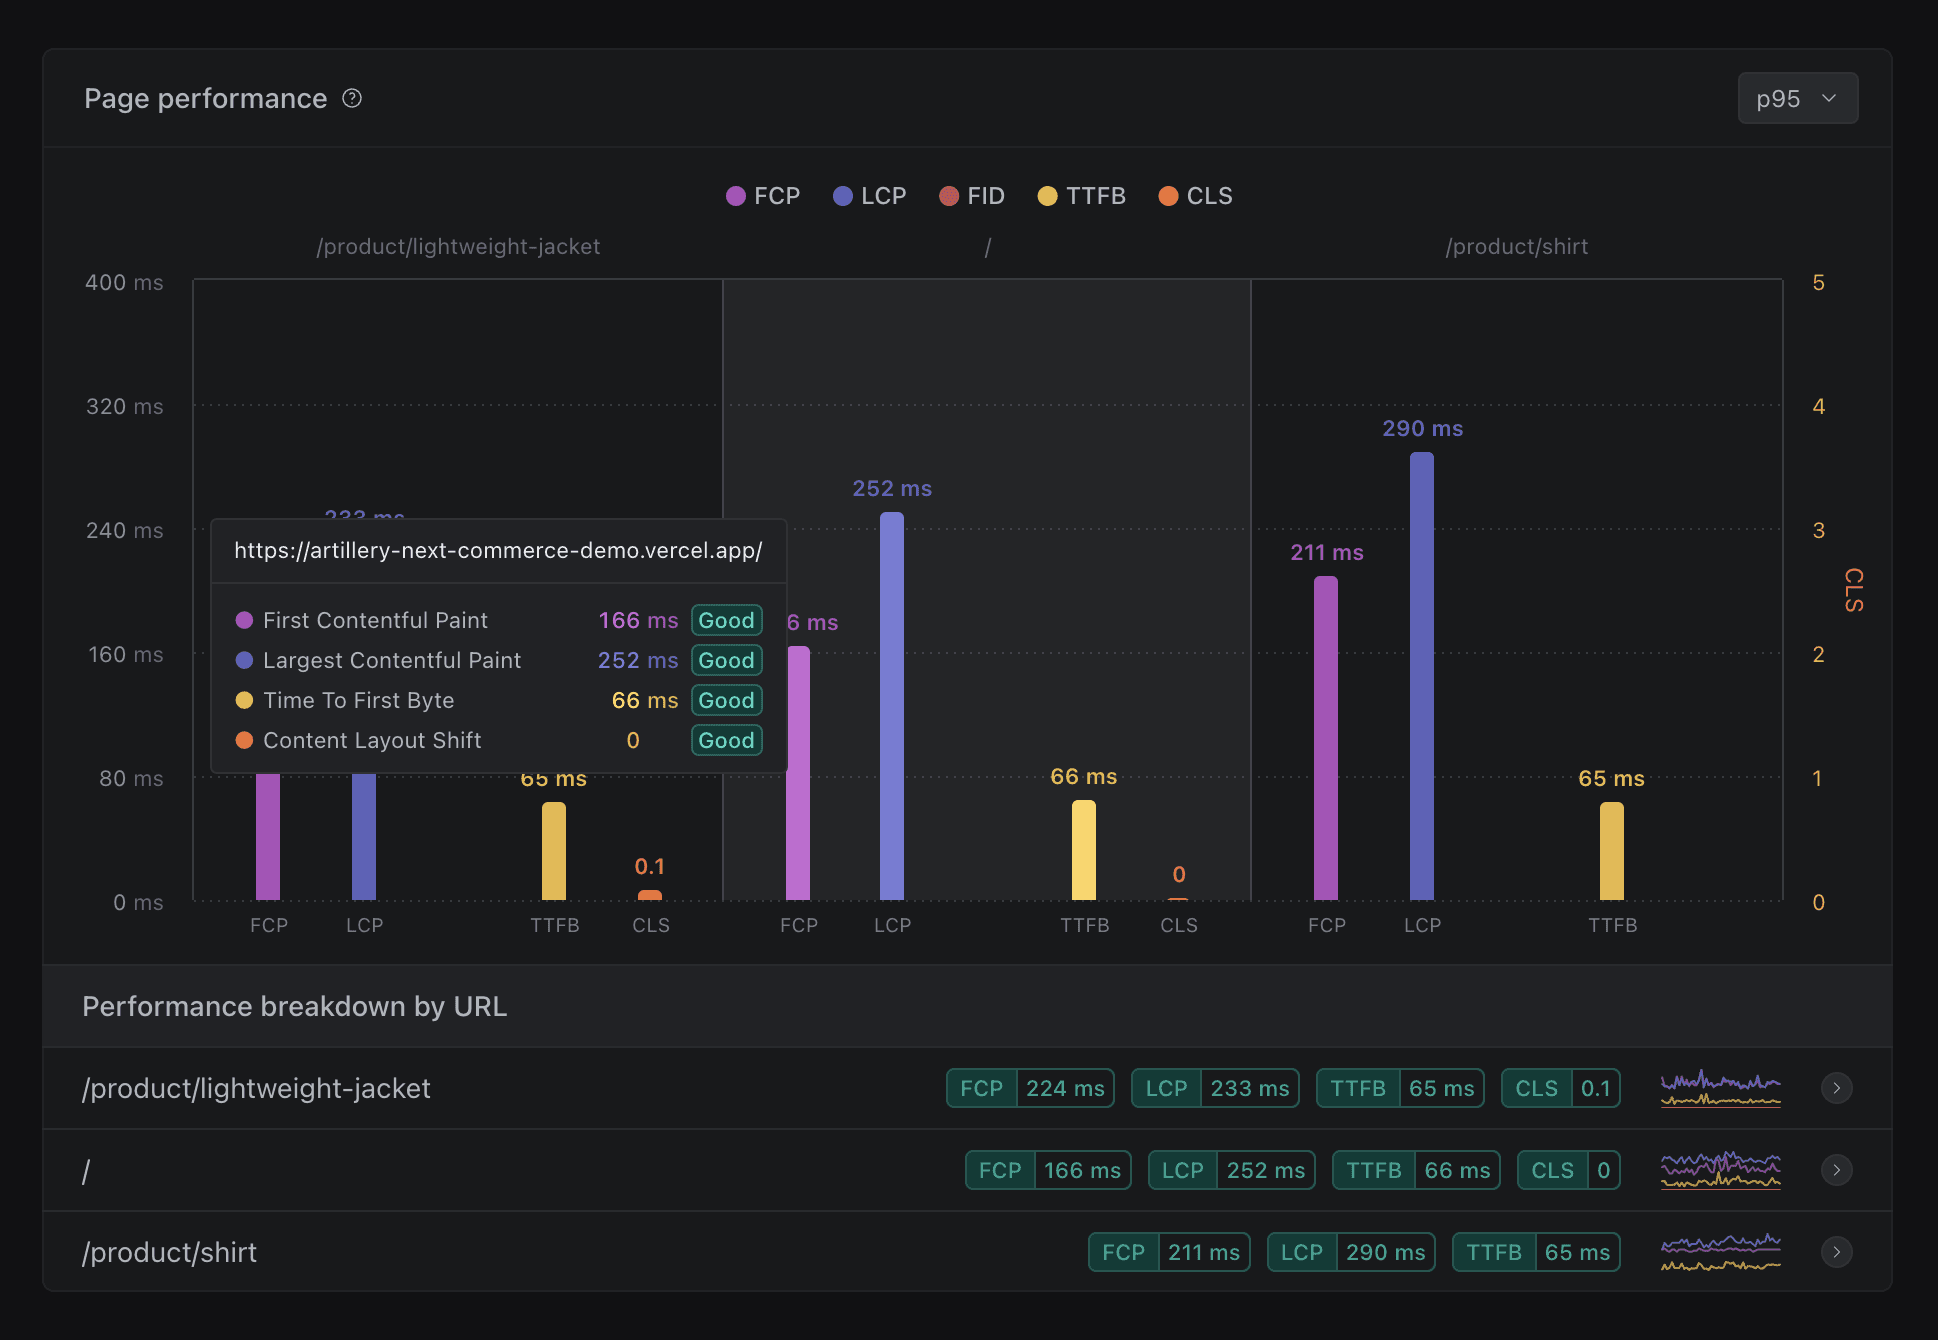
We have updated the colors for the Page performance widget so they are consistent across all charts that have the same metrics. We now show the score (good, fair, bad) for every metric on all tooltips and on also the “Performance breakdown by URL” table.
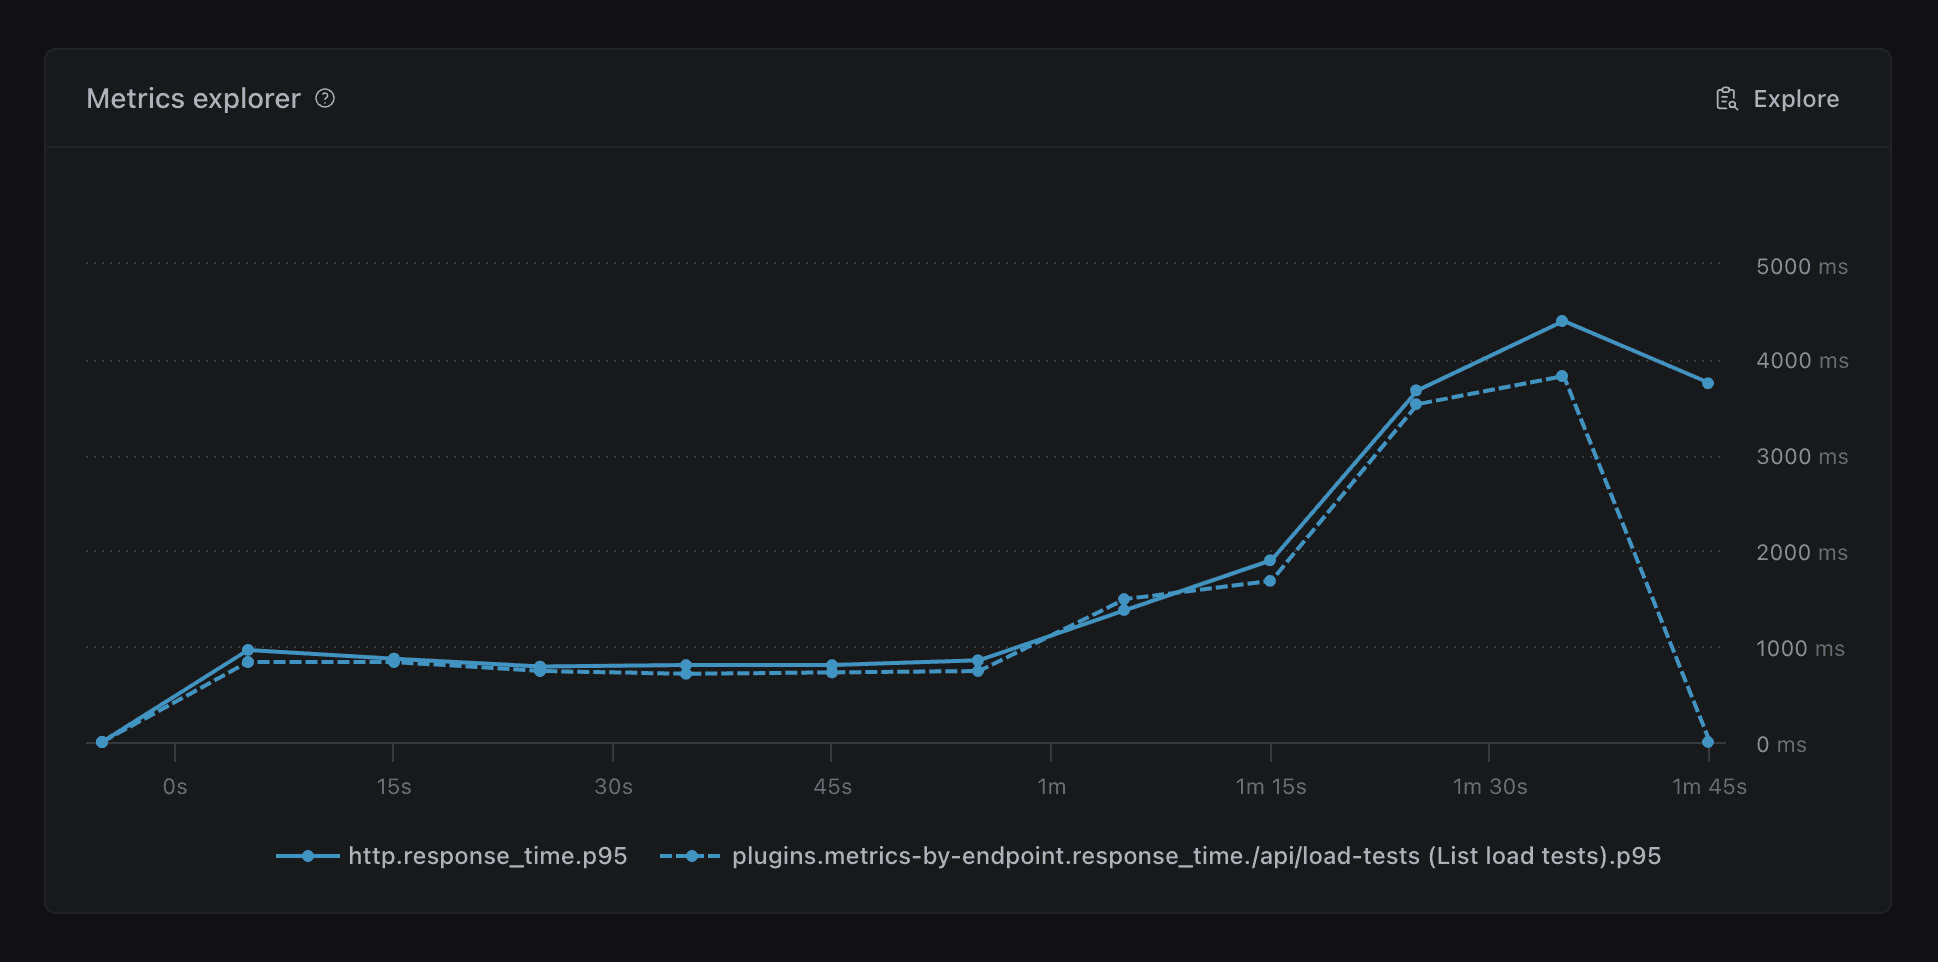
When plotting two separate metrics with the same aggregation (e.g. ) for comparisons, the series lines now show a distinctive style to improve readability.
You can now see an overview of your team’s load testing activity at a glance:
- Total number of load tests run
- Pass/fail rate. A passing test is a test that completed successfully and passed all checks if any were defined.
- Total number of virtual users created across all tests
- Total running time of all tests
Stats for all time activity are shown by default, but you can also see stats for the last 30 days.
Sometimes you need to stop a test that is currently running. You can now do this directly from the dashboard.
This works for all Artillery tests that run on AWS Fargate, regardless of whether they are triggered from a developer’s machine or from a CI/CD pipeline.
This feature requires that Artillery CLI v2.0.1 or later is used to run the test.
In order to enhance readability and efficiency, we have made the following updates to charts:
- Add timestamp to chart tooltips
- Improve color contrast for easier data comparison
- Ensure consistent chart colors for each metric across different charts
- Provide metric units on both chart axis and tooltips for better chart understanding
- For charts with multiple axis, the axis takes the color of the metric it represents
- Match the color of the chart series with metrics values on chart tooltips
- Group Apdex metrics into one chart on Reports tab
- Improve spacing around Page performance charts
- Fix a bug with the Page performance widget that affected the formatting of the x-axis
We have also improved the design of load phases on all charts. Changes include:
- Unnamed phases are now labeled as instead of
- Differentiate the background of phases from regular load phases
- Properly display gaps in data (e.g. phases)
- Resolve an issue where load phase names made it difficult to click the reset zoom button
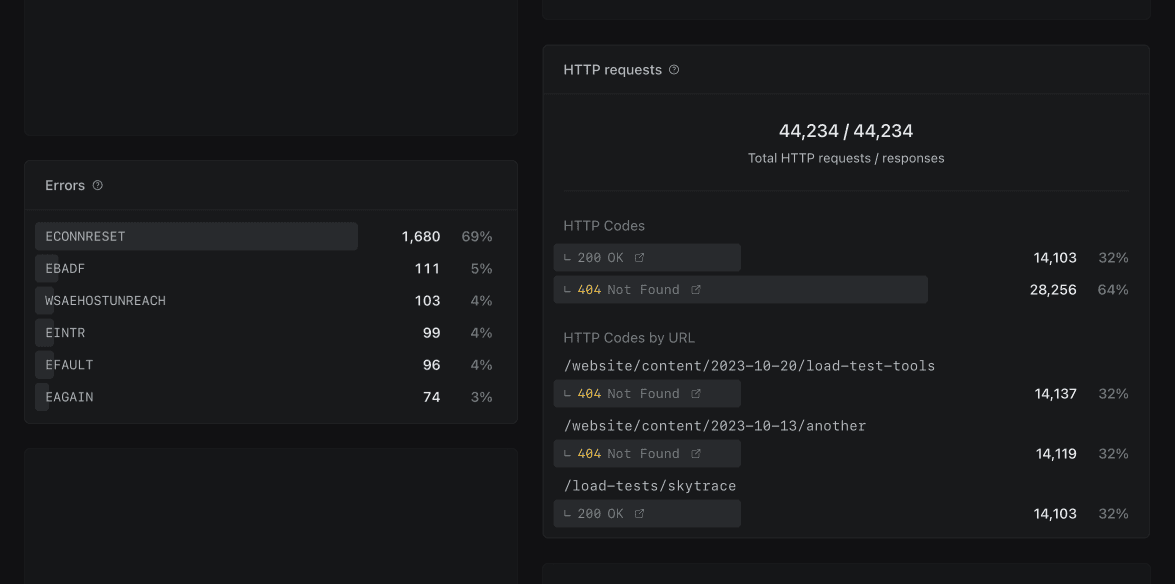
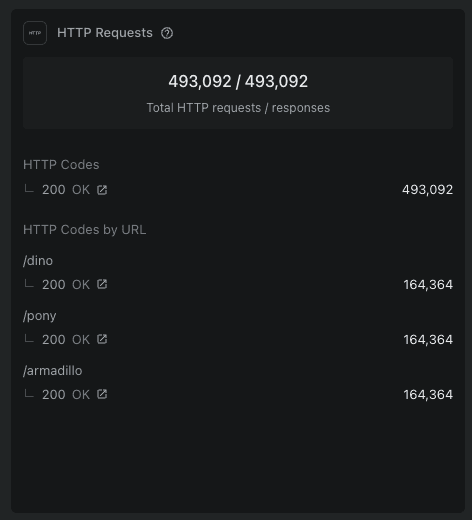
We have introduced a new HTTP performance widget that displays information for all HTTP requests. This widget offers the following enhancements:
- Display percentages and totals of HTTP requests by status code
- Improve the design of HTTP response time distribution chart
- Show the breakdown of response time distribution over time for individual URLs
- Fix an issue with missing zero values on HTTP response time distribution chart
Display information on all time series charts when you hover over the load phase name.
Improvements to HTTP Requests and Errors widgets
- Now any errors encountered during the test run will show up in the Errors widget — previously errors would only show at the end of the test run
- HTTP requests and Errors show the percentage against the total number of requests
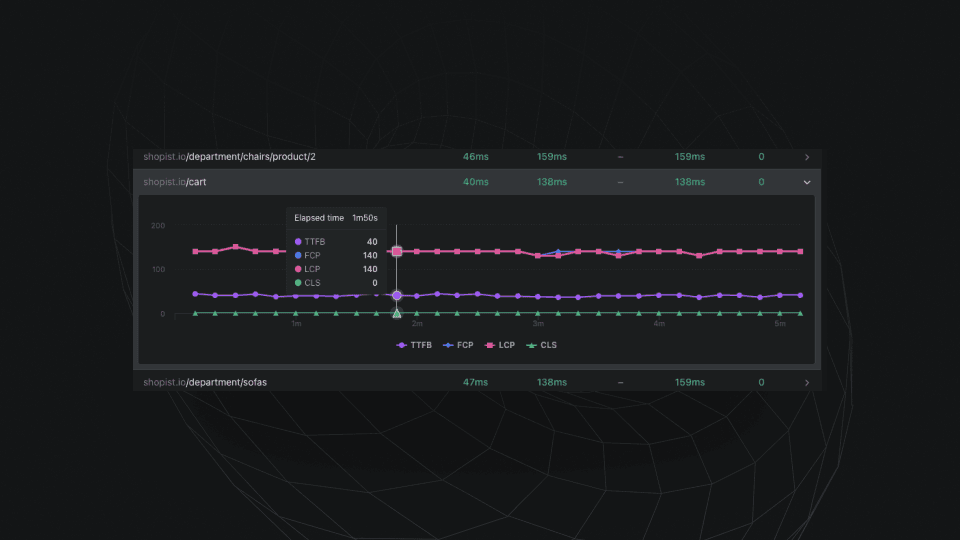
Show sparkline chart preview of Page performance scores per URL over time. This is useful to help you identify any spikes without needing to expand the chart.
- Improve color contrast across the dashboard
- Fix Group by Status test ordering on Load Tests view
We have added custom favicons that show the current test status right in your browser tab. Helps you keep tabs on your running tests and for those with multiple tabs opened.
Improve loading states for HTTP requests and HTTP response distribution widgets.
- Fix button not changing to loading state when adding notes
- Fix label alignment of axis for time series charts
- Fix HTTP codes widget returning if no data available
- Fix alignment of Page Performance table for tests with missing metrics
- Add zoom functionality to Page Performance charts
- Color HTTP codes on HTTP Requests widget to improve code recognition
- Improve typography for all charts
- Improve quickstart guide copy
Group views make it much easier to scan through your Load Tests page, specially for users that run a high volume of tests. We have added grouping by date, test status, test name, and user.
We have improved loading states and help copy on Checks, Errors, and Load Summary widgets.
Improve performance of loading screens and update its design.
- Improve Load Test page layout
- Improve handling of Cancelled tests on the new Activity widget, now it correctly shows when a test was cancelled or finished early
- Improve Load Test Reports page navigation
- Better visual feedback when submitting notes and editing forms
- Improve Logs toggle icon animation
- Improve Page Performance table responsiveness
- Show more helpful errors in the UI
- Prevent “Filter by Status” from returning Cancelled tests when filtering by Failed
- Fix user avatar aspect ratio on Metadata widget
- Fix incorrect scroll position when navigating through charts in the Load Test Reports page
- Fix number of virtual users not displaying correctly on Load Summary widget
- Fix Notes’ text not wrapping correctly on Notes widget
- Fix display properties flashing between default and user-set properties when changing pages
- Fix error being displayed when session expires, now it redirects to the Login page instead
- Fix button loading states incorrectly triggered when adding or editing notes
- Fix Test Logs area expanding after user collapses it
This update is focused on improving visibility of test phases for tests in progress.
- Improve current test phases visibility for tests in progress
- Outline important test information in a easy to read widget
- Move Worker Logs next to Text log to improve logs discoverability
- Improve Text log loading state by showing CLI loader
- Add auto scroll to Text log
- Improve readability and contrast on Text log widget
- Update Text log to always show scrollbar if content is scrollable
- Improve design of error screens
- Group metrics under one chart on Test Reports
- Add tooltip to display properties button
- Improve layout of Header and Load Test view on for screen sizes medium and smaller
- Animate Metadata duration to match real-time data elsewhere
- Fix Metadata duration showing for tests in progress
- Fix issue where Text log would show “N/A” on page load
- Fix a bug with tags not showing for some organizations
- Fix page zoom when adding notes to tests on mobile devices
- Fix test list view alignment if user info is not available
This update is focused on many small improvements to improve overall information density and make it easier to understand load testing activity at a glance, as well as to make it easier to analyze individual load test runs.
Test list view
- The results of can now be inspected inline. The count of notes added to a test will is now also shown inline.

- Elapsed time is now updated live for in-progress tests

- Display relative dates in the list view, and show the full timestamp on hover

- Tests that run on AWS Lambda and AWS Fargate will now be shown with the appropriate icon for those services

Load test view
- All timeseries charts will now overlay the name of the load phase and show absolute timestamps for X axis labels

- Add metric toggles to for hiding/showing specific aggregations on HTTP Latency Distribution widget

- Make metadata view more compact and easier to scan

- Improve empty states on Checks, Metrics Explorer and Errors widgets

- JSON reports can now be downloaded from the context menu

- The list of tags will now show more tags by default to increase information density
- The tag is no longer shown in the list of tags (the tag sets the name of the test shown in the list)
- Match styling of tags in filter dropdown to styling used elsewhere in the UI
- Fix a bug with date filter not always resetting the selected range as expected
- Fix a bug in date filter where the displayed range could be off by one day
- Fix a bug in date filter where future dates would be shown in date filter
- Fix content overflow on Errors widget when there’s a lot of error data
- Fix a bug where filtering by tags would not work correctly
- Fix a bug where filtering by status would not work correctly for tests that included failed checks

We’ve reorganized the layout of individual test reports to make notes more prominent, improved readability of the metadata section, and created more room for useful visualizations in the main area.
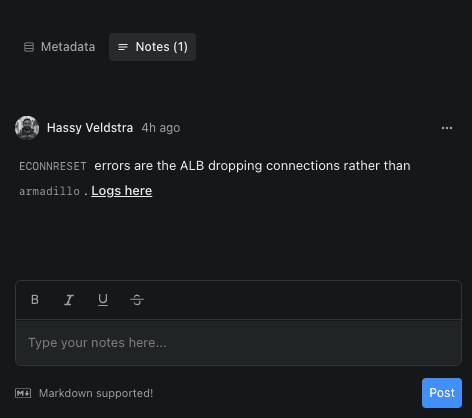
Notes
Notes provide a way to annotate test runs with useful information such as links to external logs and dashboards, and for recording results of investigations into performance issues found by load tests.
We’ve now pulled them out from a separate view to make them more accessible.
Other fixes & improvements:
- Remove shadow overlap on first note
- Tweak microcopy to make actions clearer
Metadata display
- Test timing information has been moved into the sidebar to give more space for data widgets in the main area
- Make Metadata section collapsible
- Improve spacing on list of CloudWatch Log Streams for Fargate tests
- Move “Add note” to the top so notes are added right below it, better UX
- Tweak styling of rendered Markdown for better readability
- Improve handling on small screens
- Improve alignment and padding of metadata items
- Fix issue that could cause all charts to rerender when not necessary and lead to charts jumping around
- Improve responsiveness of Page Performance widget
- Improve spacing on Error summary view
- Add empty state to Counters summary
- Test IDs can be copied by clicking them
- Fix bug that could cause new tests to show up as “Untitled Test” for a short period of time
- Fix bug that prevented deep links to charts from working
- Error dialogs and error handling. Error responses in both the UI and API will now include unique error IDs that are tied to error logs
- Fix bug that would cause some pages to show loading skeleton indefinitely for logged out users
- Fix alignment of loading indicators on buttons across the app
- Improve contrast for all popovers and dropdown menus across the app
- Make styling of all external links consistent through the app
- Remove banding on the gradient in the header
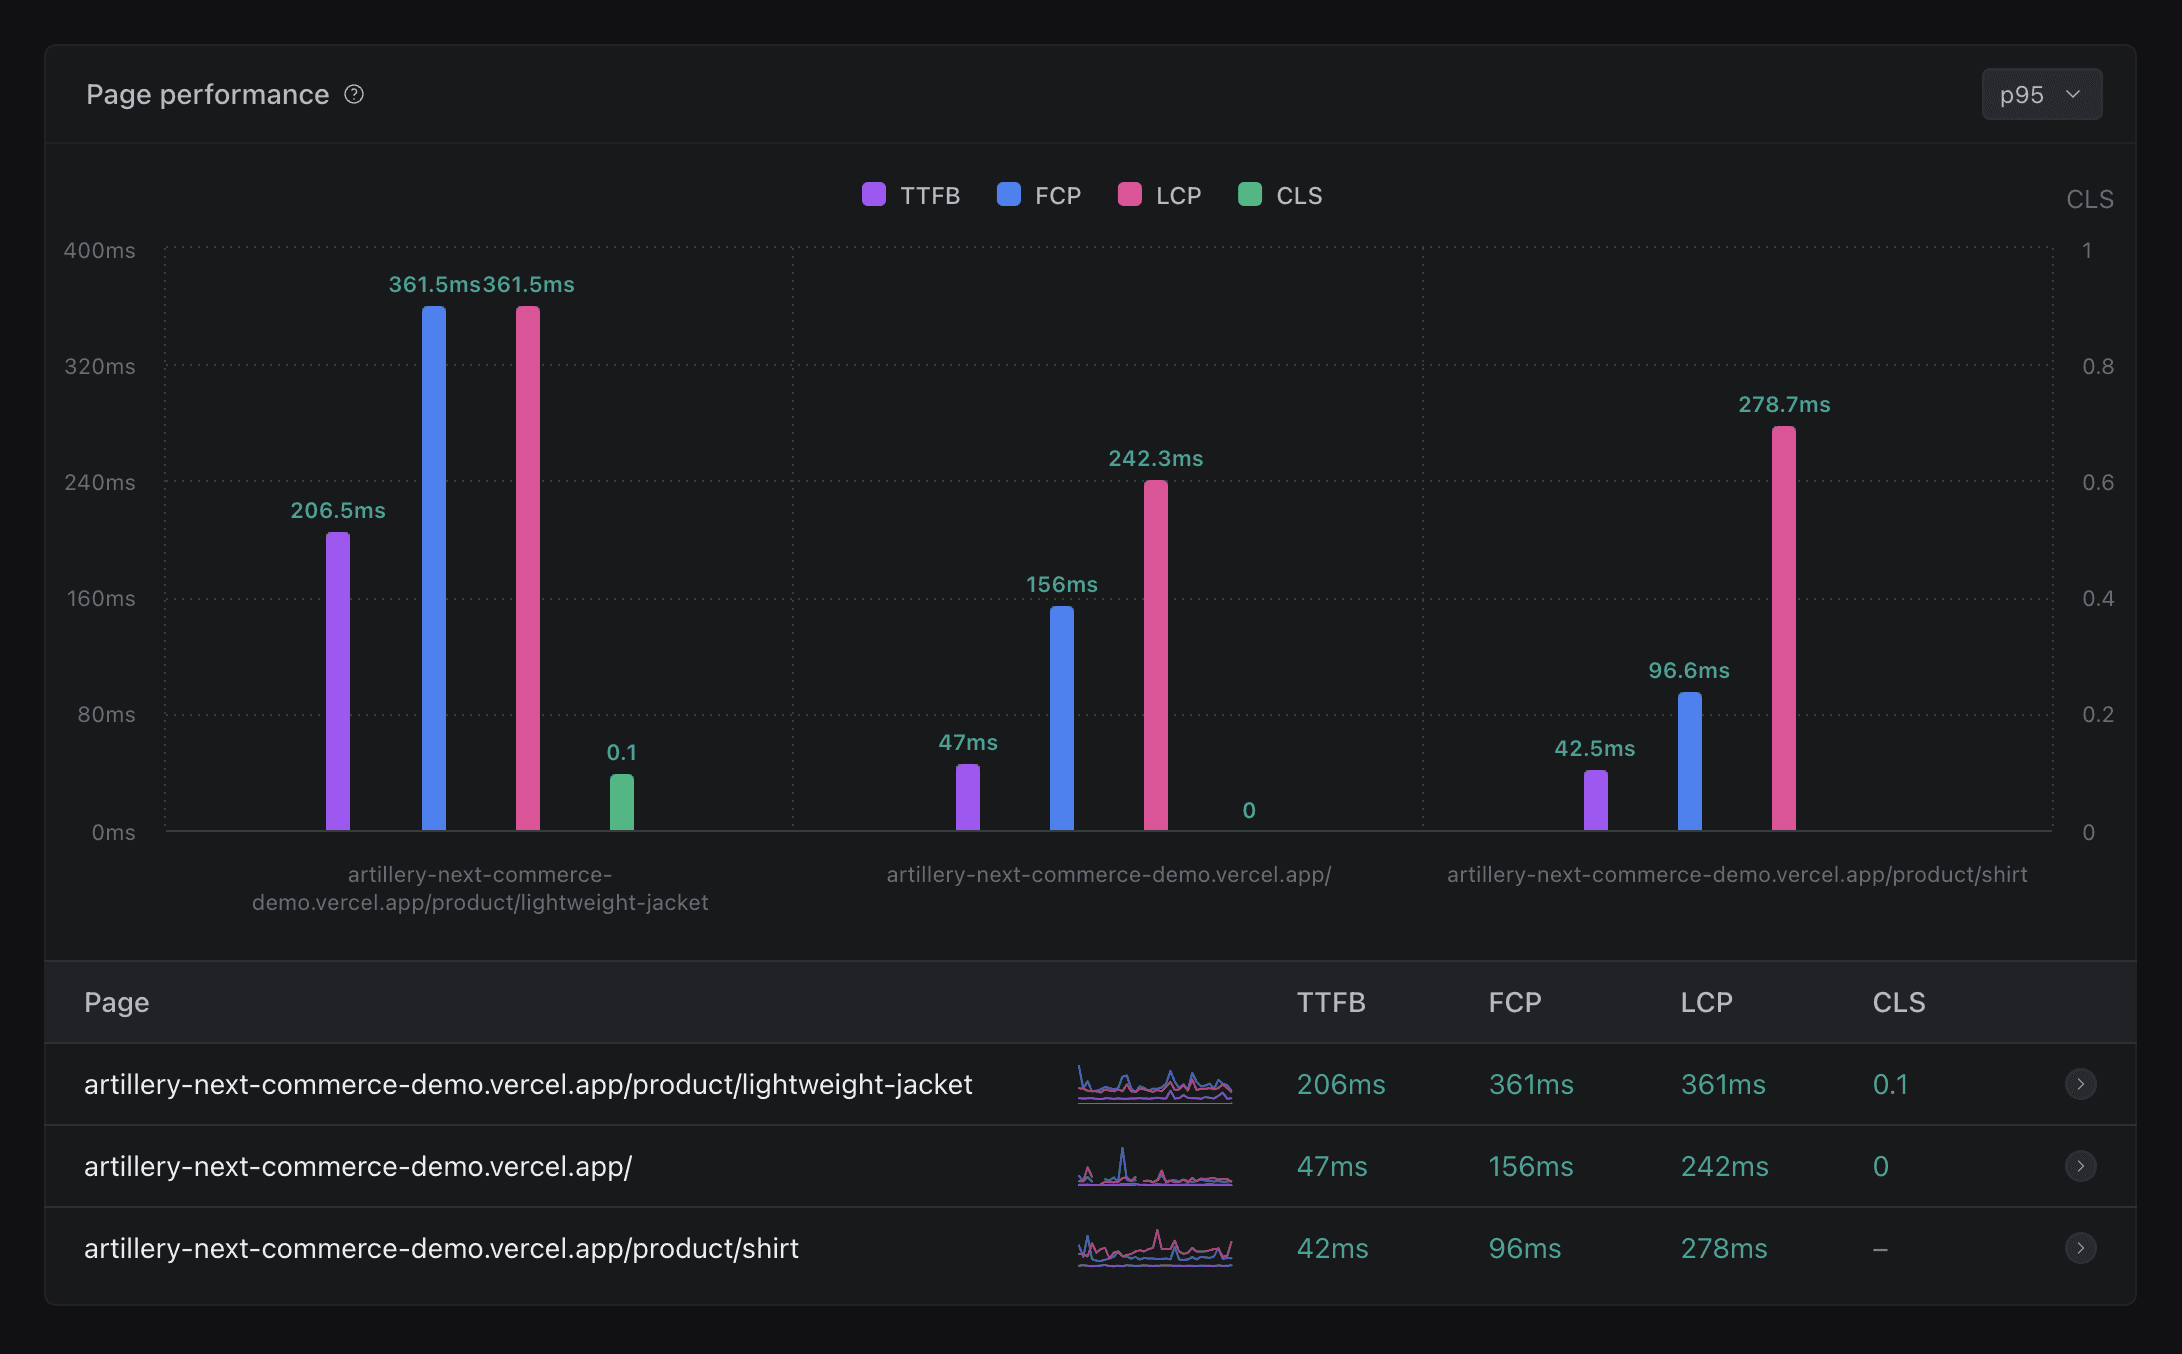
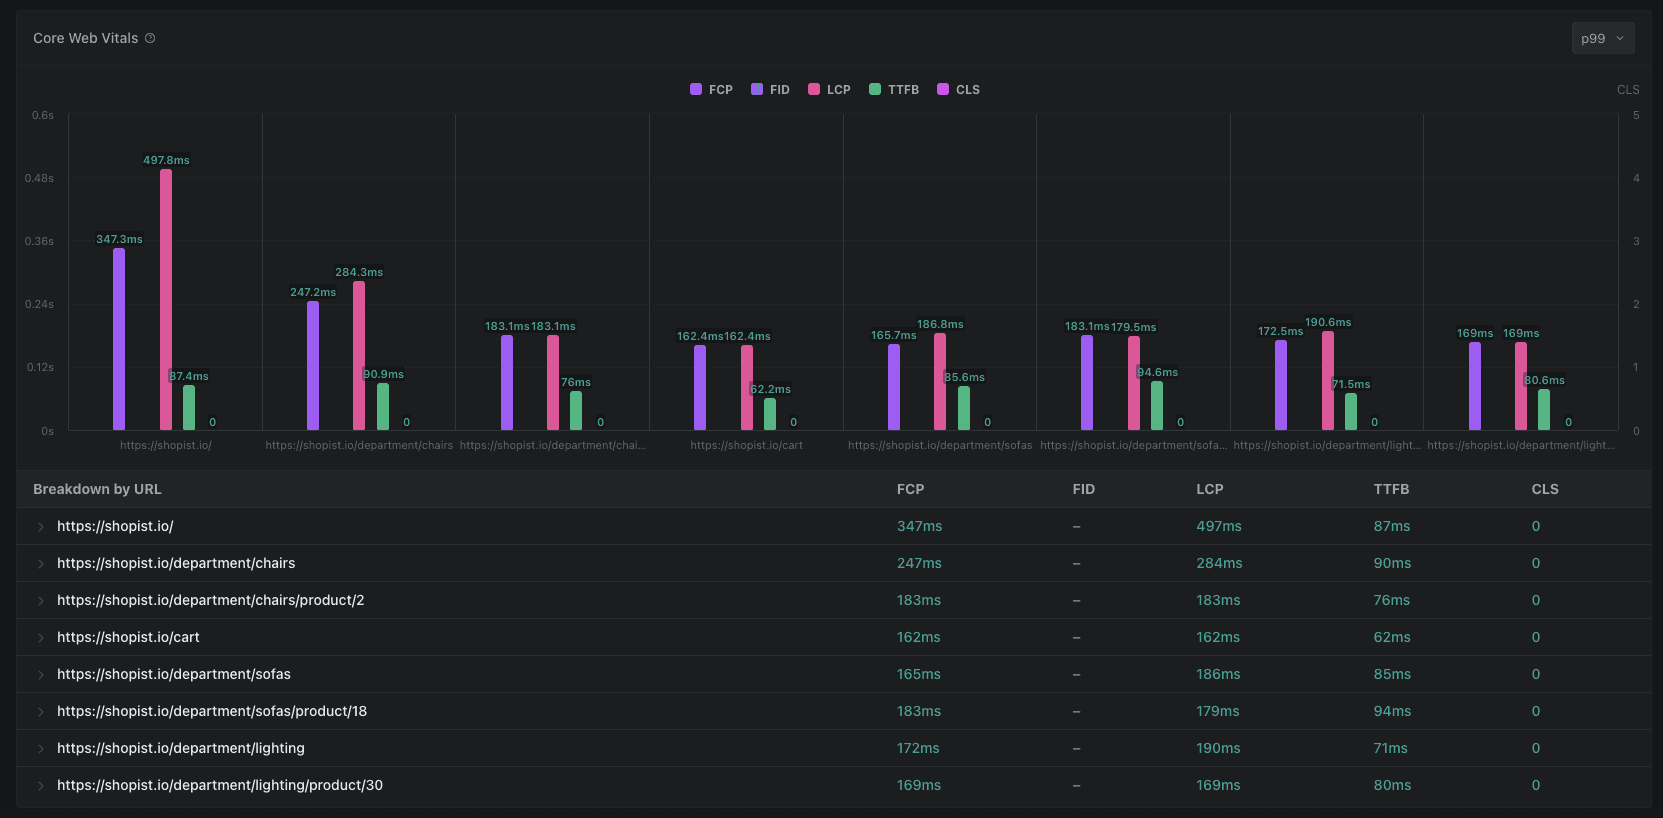
See how Core Web Vitals change under load
You can now see Core Web Vitals measurements for an entire test run, and understand how user experience is affected by high load.
Switch between p99, p95 and median
We have added the ability to switch between , and aggregations for visualizing Core Web Vitals metrics.
Other improvements
- Improved layout and spacing for tooltips and charts
- Improved handling of overlapping text.
- Improved readability with tweaks to x axis labels and URL formatting
- Improved toggle interactions and animations
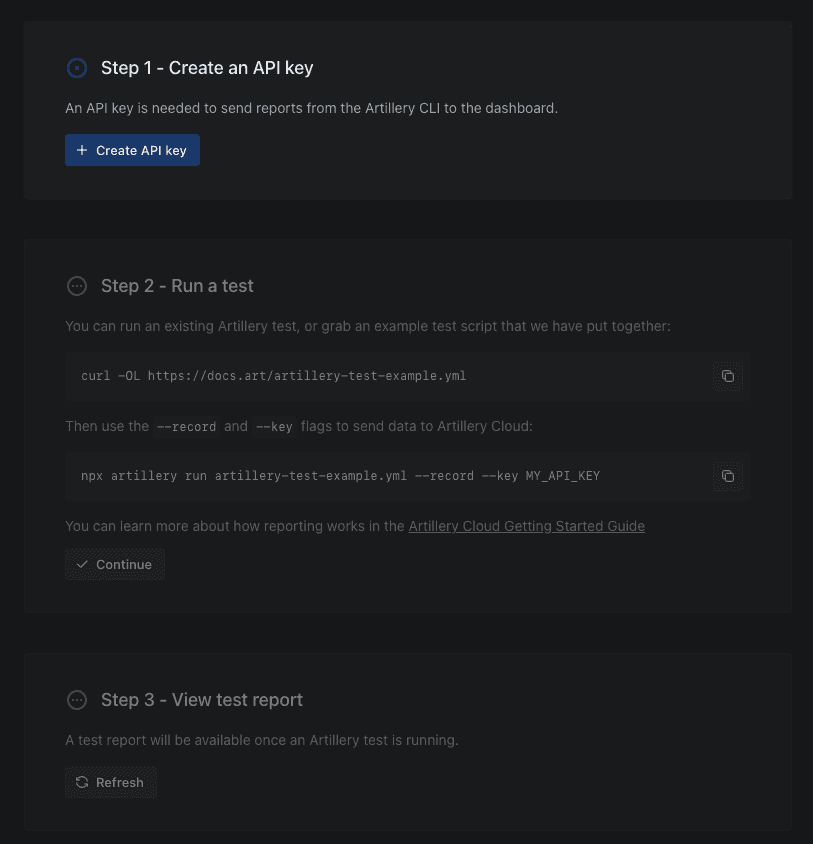
We have added a new quickstart wizard which lets you go from first sign-in to running a load test in 3 steps.
- Display the user who triggered a test in the metadata sidebar
- Add option to display the user who triggered the test in the test list view
- Fix issue where dialogs could close themselves accidentally
- Fix incorrect default labels on some charts
- Improve default error pages
- Fix regression on response time widget displaying an unnecessary count metric
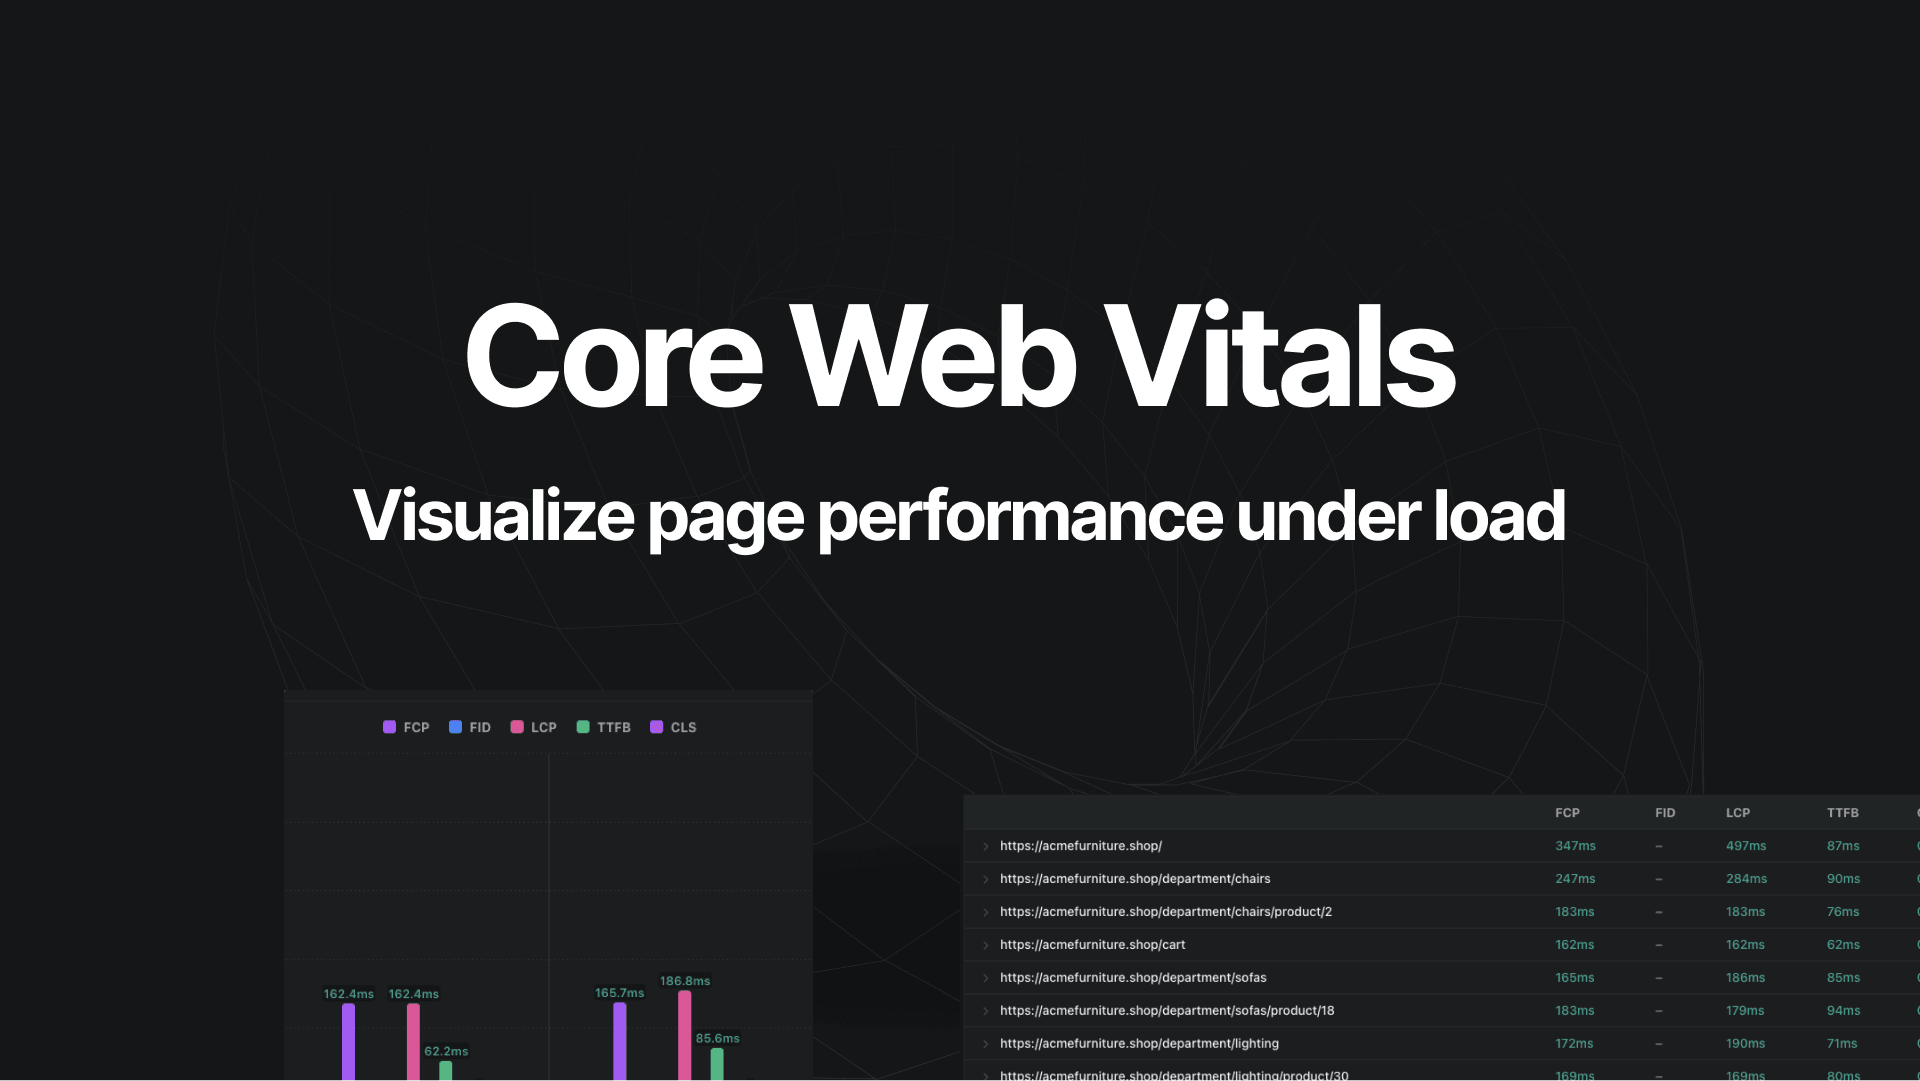
is a set of key frontend performance metrics that measure user-perceived performance of a web application.
The dashboard will now visualize the performance of every page for load tests that use . This will help you understand how user-perceived performance is affected by high load.
- Add syntaxt highlighting on JSON report views
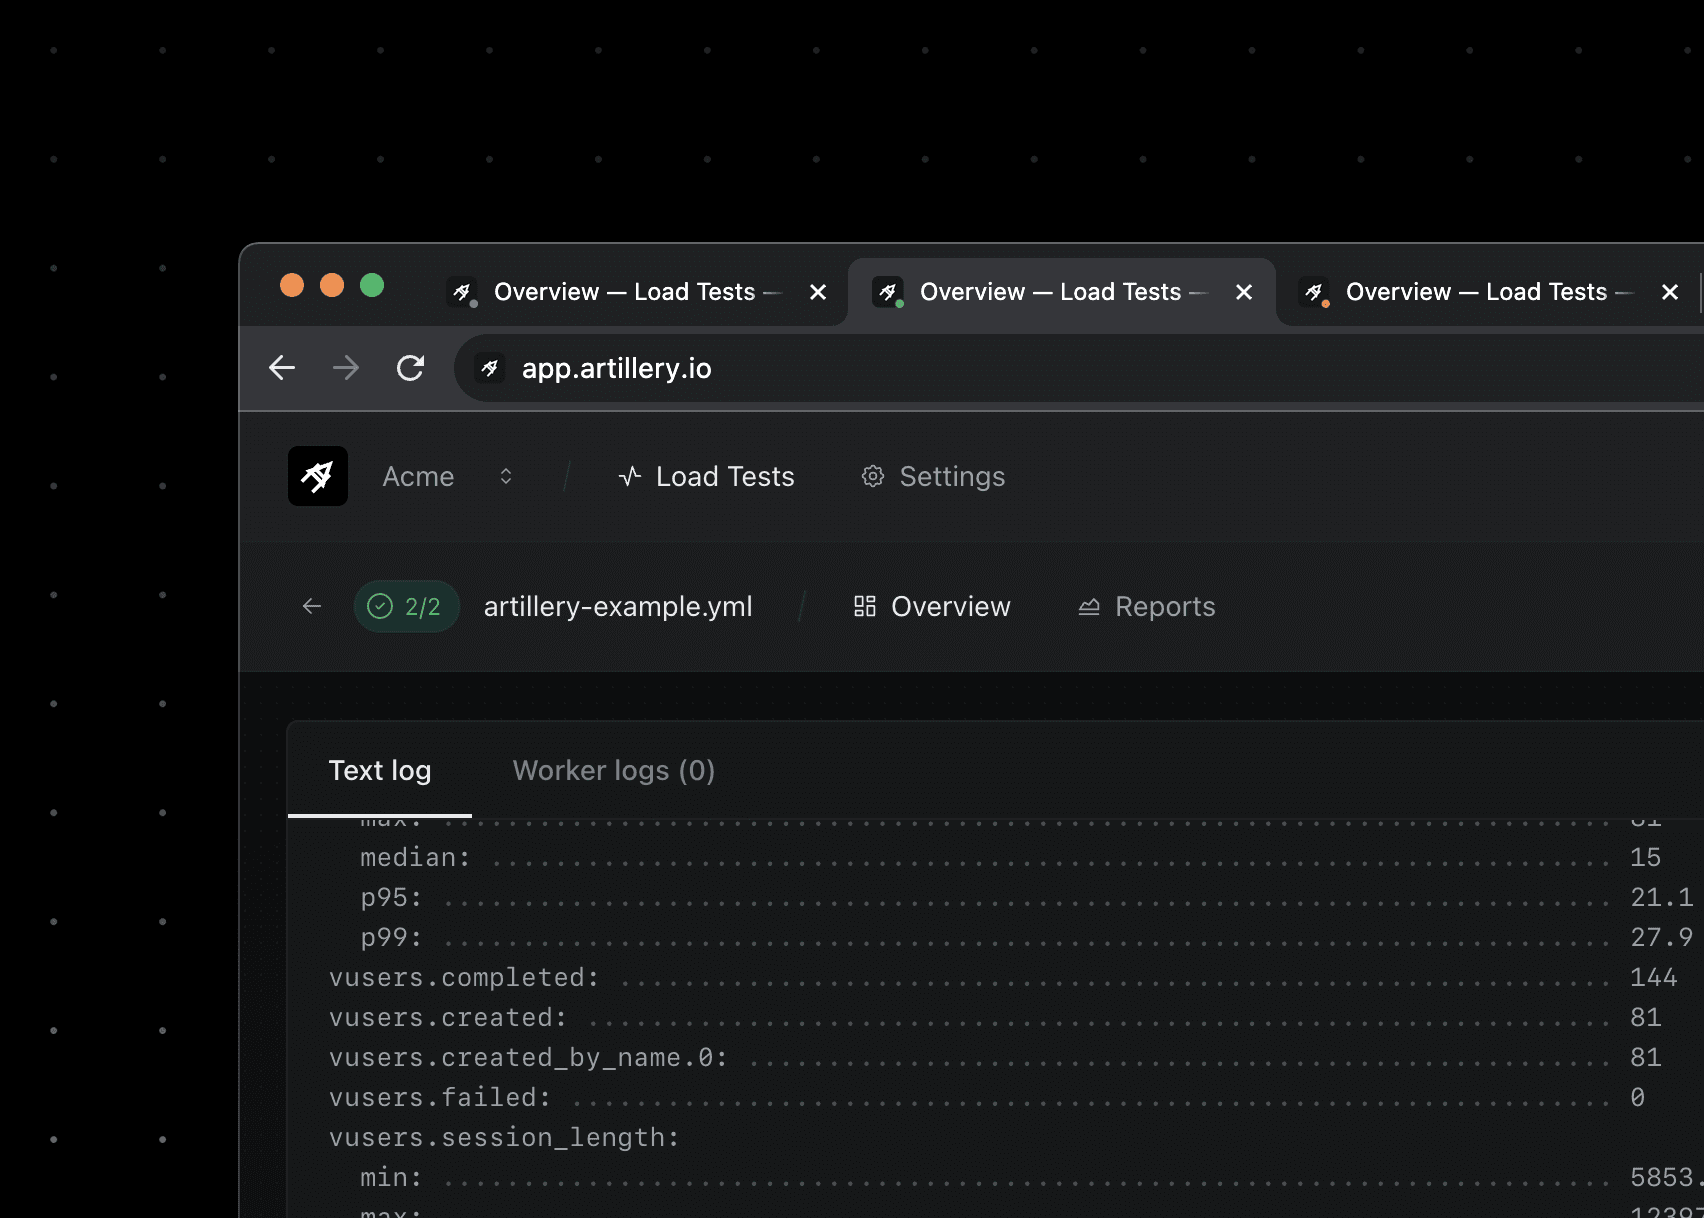
- Tail text logs for in-progress load tests
- Replace popover with inline editing for notes
- Notes can now be posted with Ctrl + Enter

The main load test list now shows the results of so that you can see at a glance which tests succeeded and which ones did not meet performance thresholds.
We recommend using for all regular tests to help make sure that performance goals are met.
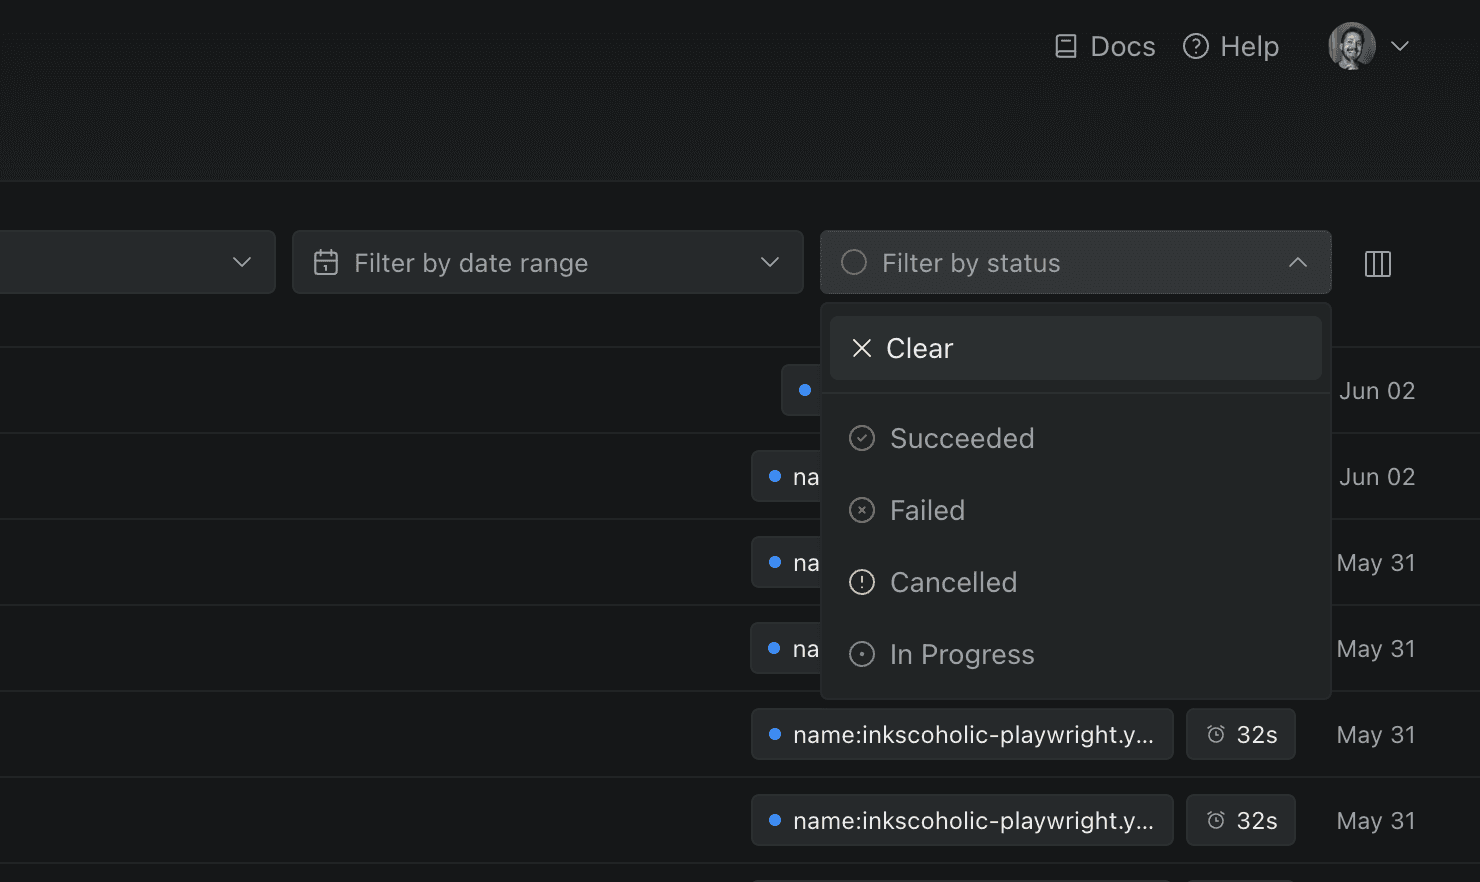
We have reduced the number of status filters down to just four: Succeeded, Failed, Cancelled, and In Progress. A test run that sets ensure checks is marked as Succeeded only if all checks are successful.
We have done a comprehensive overhaul across the whole interface of the application, updating component surfaces, font sizes, animations, and more, to make the UI feel more consistent, accessible, and easy on the eyes.
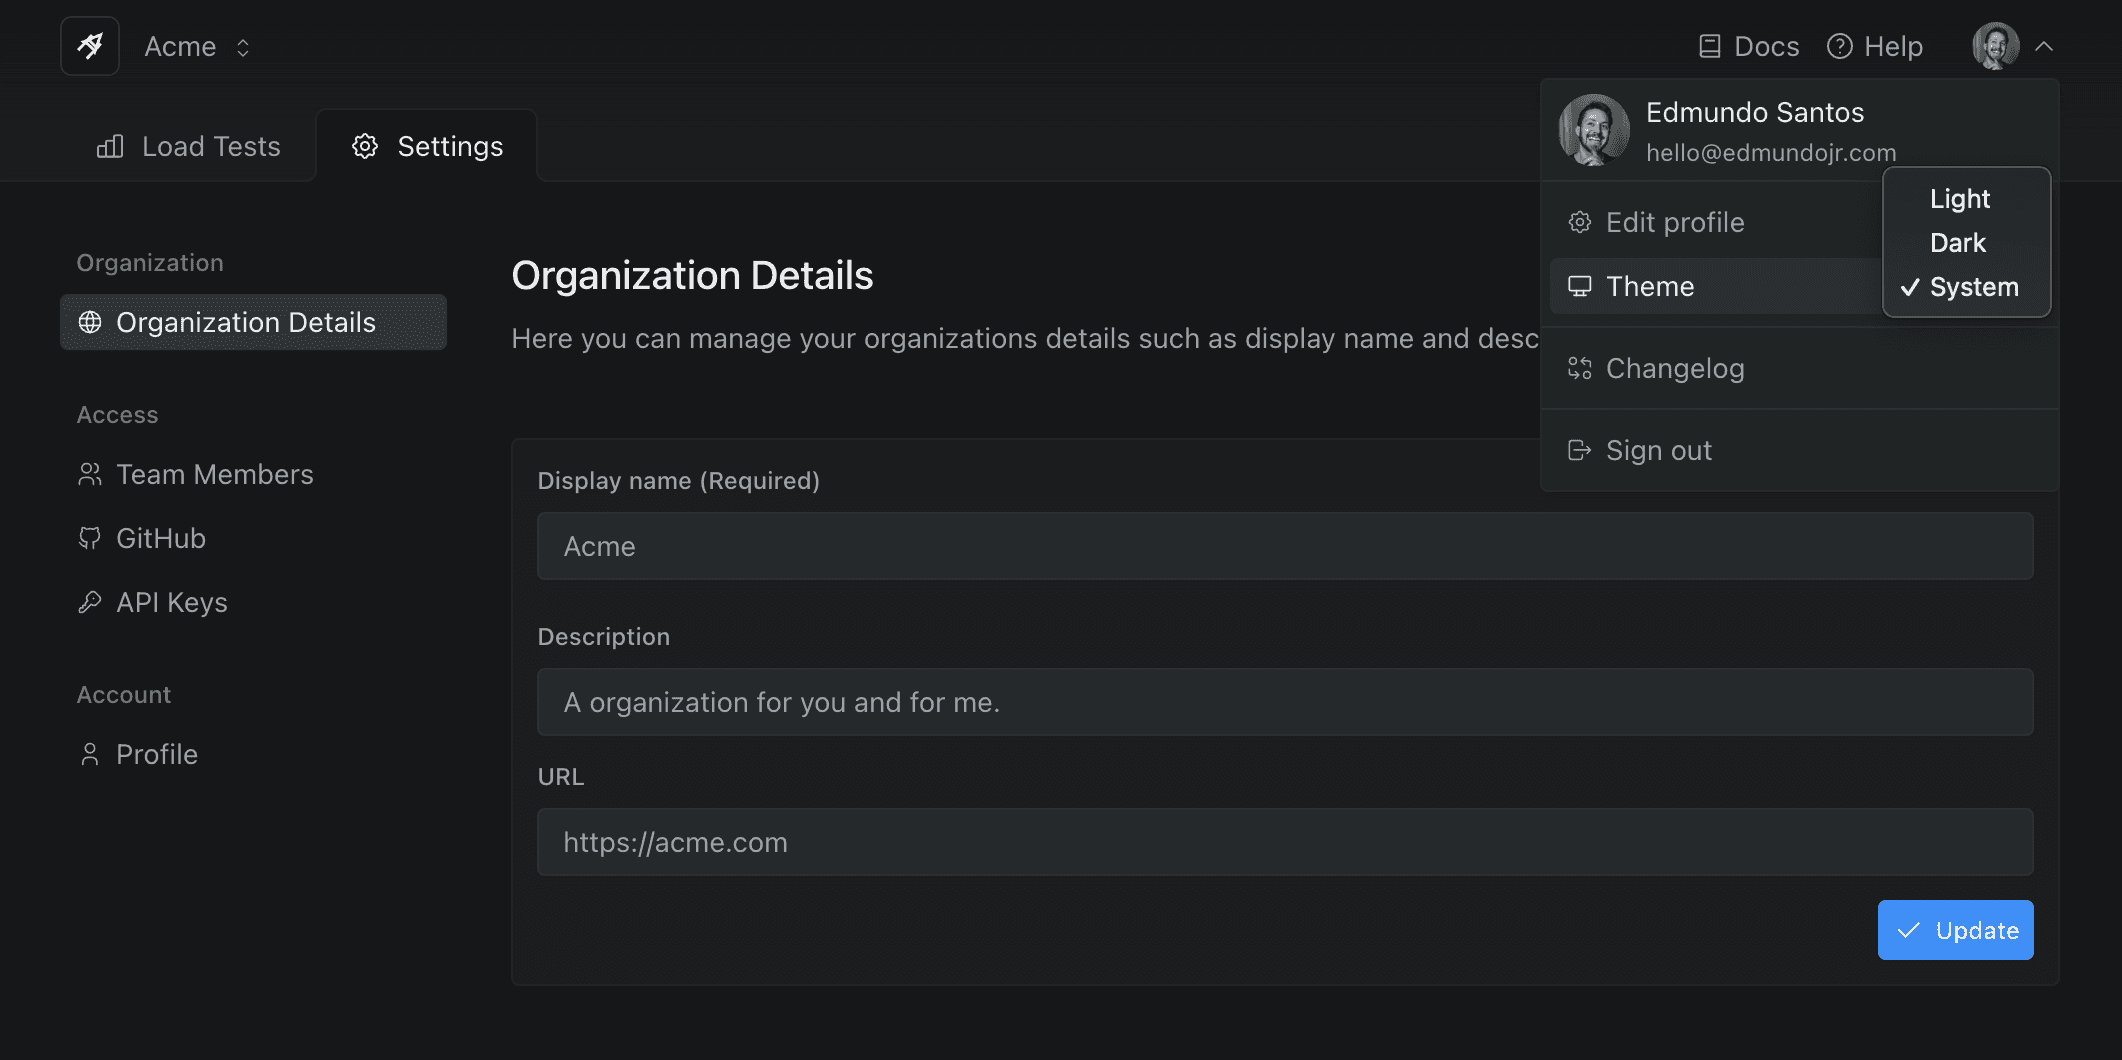
The Settings area has been updated to make navigation easier and now includes the ability to edit organization and personal details.
It’s now also possible to pick a “system theme” which makes our UI follow your operating system’s light/dark theme.
- Performance improvements: faster loading of individual load tests, and settings pages
- Fix bug with searching by test run ID that would cause older test runs to be omitted
- Make Settings navigation fully responsive on mobile
- Add infinite scroll for the main load test list view
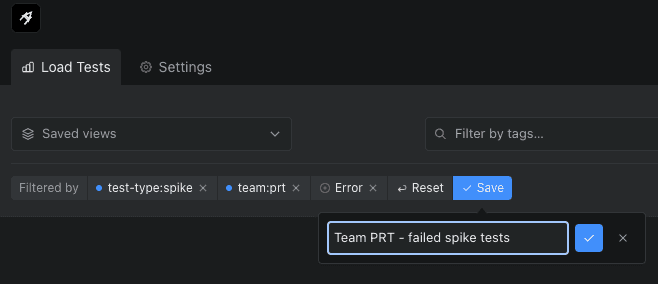
To make getting to the information you want faster, the dashboard supports Saved Views now. Any combination of tag filters, date filters, and test status filters can be named and saved as a view.
Team member and auth management
You can now manage current team members, and the GitHub allowlist that determines who may join your organization from the Settings area.
Overview pages are now live and can be used to follow the progress of an in-progress load test.
Denser and more scannable list view
We improved information density and scannability of the main load test list view. The default page size has also been increased from 10 to 50.
Create API keys to or to create custom integrations with Artillery Cloud.
Performance and reliability improvements
We spent a lot of time on refactoring and optimization. End result: a leaner, snappier and more responsive UI.
- Show the name of current organization in the header
- All execution platforms can send data to the dashboard now - local, AWS Lambda and AWS ECS/Fargate
- Allow flash messages to stack
- Improve responsiveness of side navigation on test reports
- Add tooltips for tags in the main list view
- Fix bug with the direction of the arrow on the user dropdown menu
- Match loading skeletons with layout across the app
- Make dialog entry/exit animations consistent
- Fix dialogs not showing if page height was larger than viewport size
- Fix bug when active tab inside load test view would not be highlighted correctly
- Improve spacing, grid styling, and tooltip styling on all charts
We have released a big update to the Artillery Dashboard with a focus on improving the Overview section and our charting engine to let you understand load test results faster.
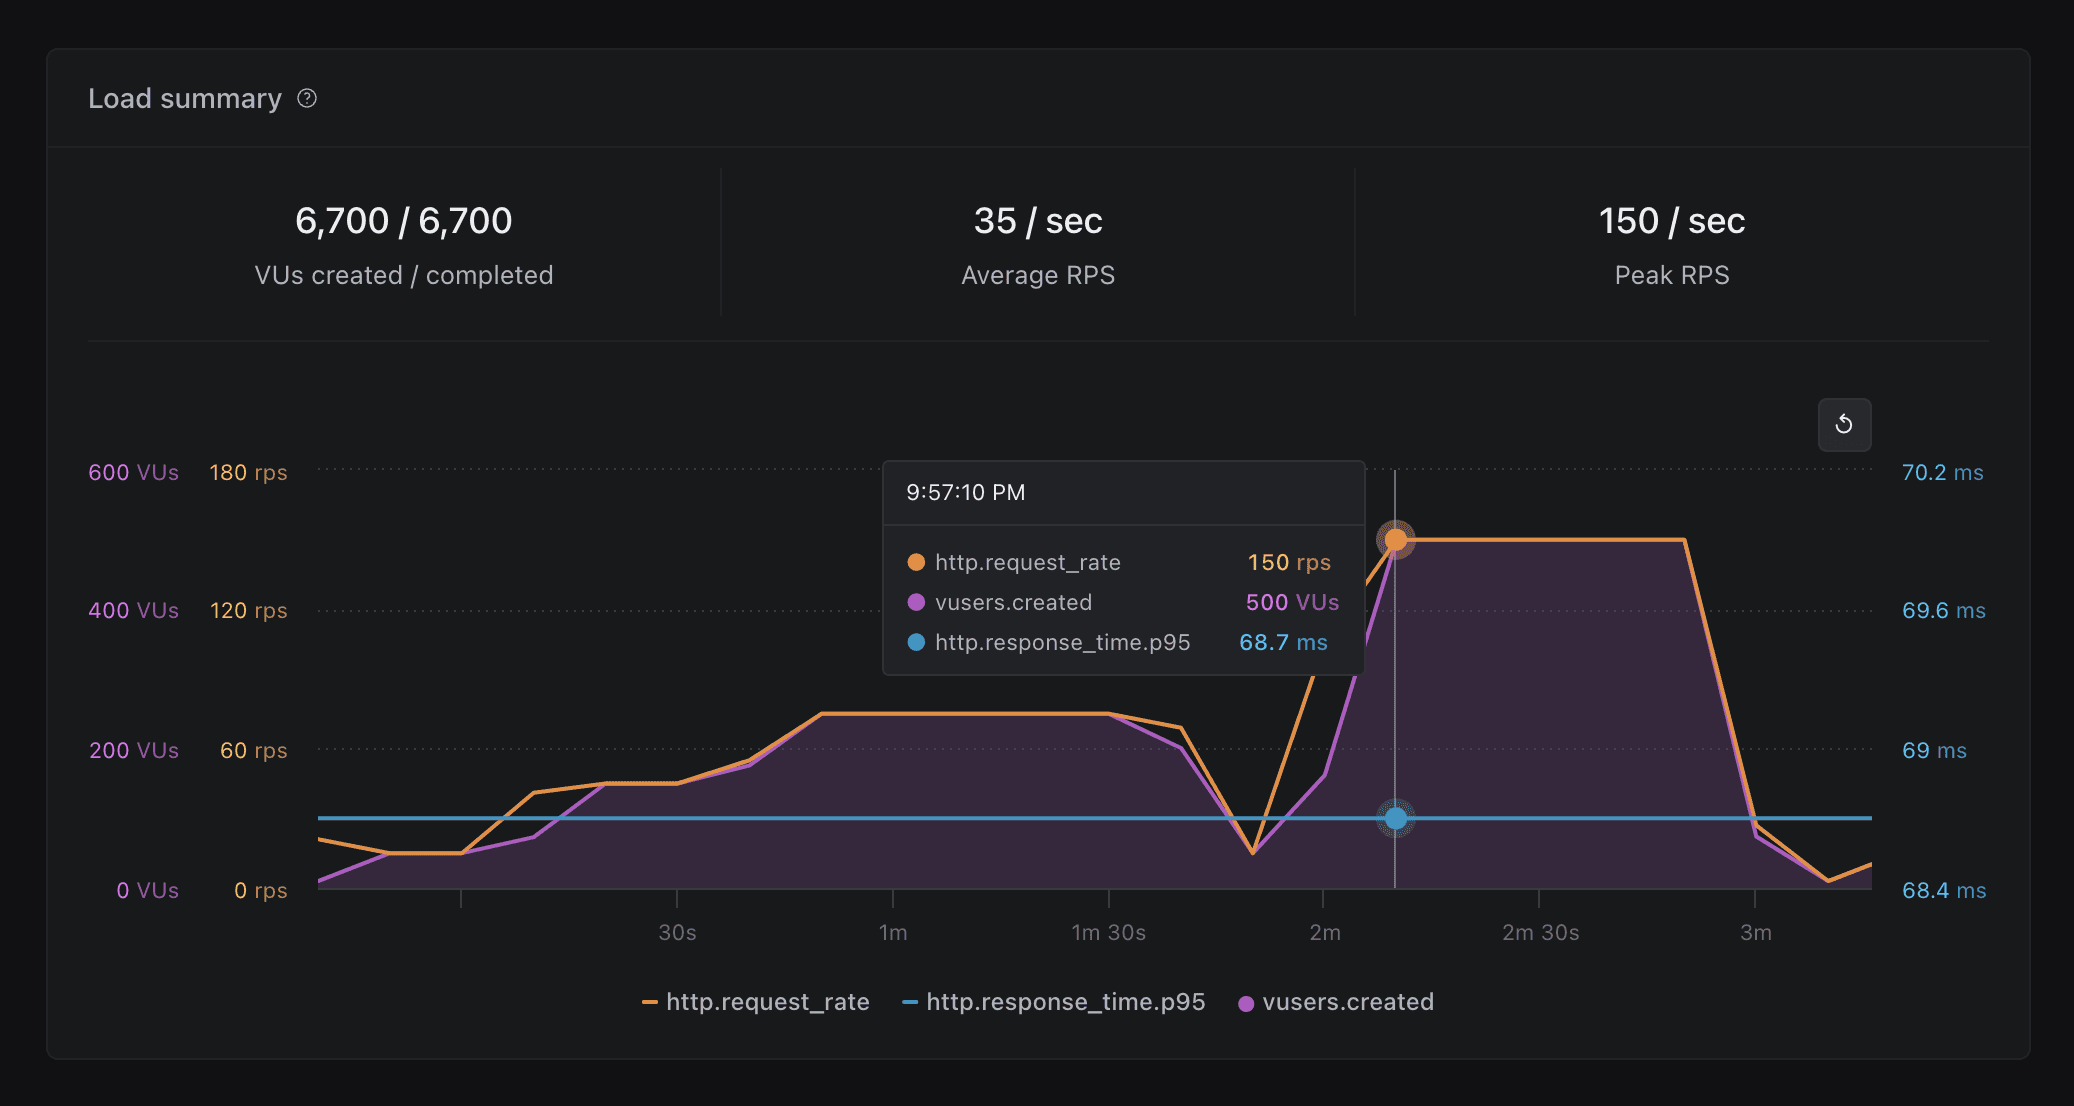
- Show Peak RPS achieved during a load test run
- Display errors (if any) at the top of the screen
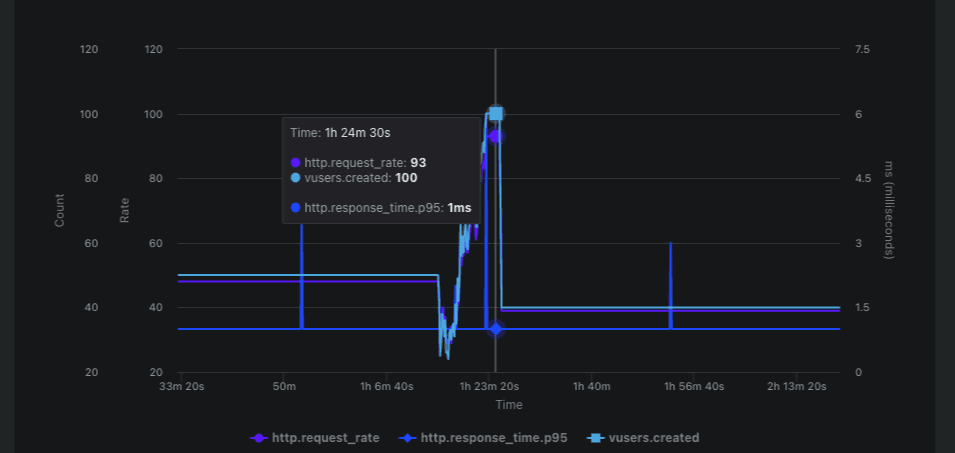
- New “Load Summary” chart to visualize request rate, response time, and VUs created across the test run
- Show a breakdown of HTTP codes by URL
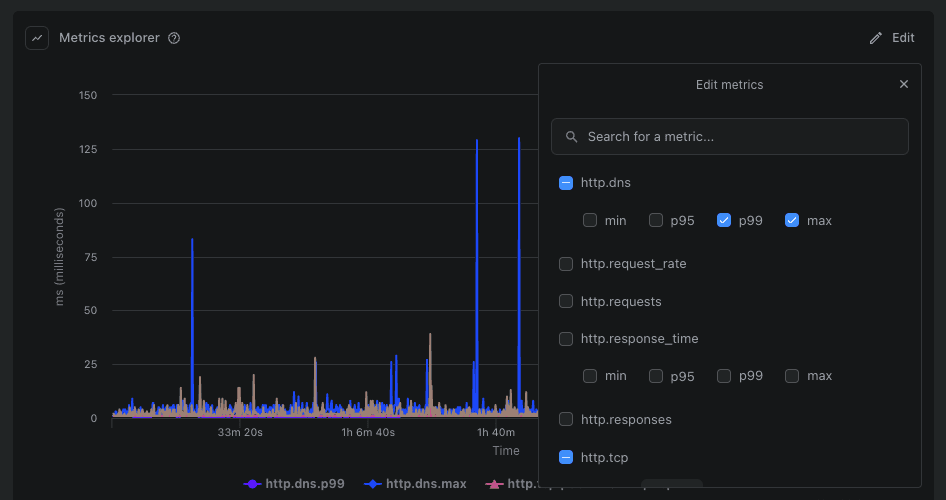
- New “Metric Explorer” widget to let you chart and compare any metric (including custom metrics) generated by the test run
Fixes, Tweaks and Polish
- Layout: tweaks to spacing across the board to increase information density and make more room for what matters. Improved layout of the main test list view and individual test views.
- Charting: ability to combine multiple metrics on one chart
- Charting: show combined tooltips for each point along the time axis
- Fix for sidebar and main area overlapping at some screen sizes
- Fix issue with flash messages disappearing from view
- Improve tag list display in the main list view
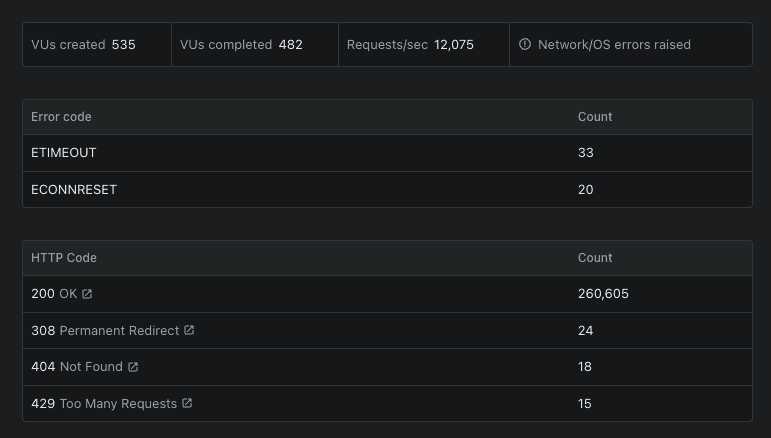
The new Overview section provides at-a-glance view of what happened during a load test, including:
- Status of .
- A summary view of all errors raised during the test (if any), such as request timeouts, dropped TCP connections etc.
- A summary view of HTTP codes, HTTP request rate, and response time distribution (, , , , and ).
Capture the results of performance investigations and link to relevant external resources such as Datadog dashboards, Kibana logs, or JIRA tickets. With full Markdown support, and ability to .
- Color palette improvements to improve readability
- Fixed an issue with displaying charts for tests that generate a lot of data, such as 8-12 hour long soak tests
- Fixes to zooming and panning
And finally, if dark mode isn’t your thing, the dashboard has a light mode now. Toggle it on via Profile -> Light Mode.

An Aurora Serverless database cluster may now be used as the backing store for Artillery Pro.
This requires Data API to be enabled on the cluster. Only Aurora Serverless v1 is supported right now.
Fixes & Improvements
- Improve loading states on the Settings screen
- Fix bug with context menu getting cut off
- Fix double-trigger on context menu buttons
Artillery Pro v3.0.0-10 has been released ()
New
- Add support for loading enviroment variables into workers from a .env file with flag
- Include extra information in JSON reports: test metadata, test run ID, and ensure check results
- Include launch platform and subnet information in environment summary output
- Test runs are automatically tagged with , which is set to the test run ID
- Print test run ID at the end of the test run
Fixes & Improvements
- Exclude raw histogram data from JSON reports to reduce file size
- Fix an issue which could prevent ensure checks from running
- Fix an issue where only one flag would be taken into account
- Show auto-guessed subnet IDs when subnets aren’t set explicitly with in

A long requested feature of our dashboard has been the ability to login with GitHub. A layer of authentication removing the need for VPN’s on your end.

With the latest we’re shipping:
- Authentication
- Fixed a bug relating to Load Test table horizontal scroll.
- Load tests now fail a little more gracefully with more robust checks for data.
- Also improvement on empty states when a Load Test is firing up.
- Added querying for XML/HTML responses with Cheerio
- Latest release of Kubectl plugin is out now! Find it .
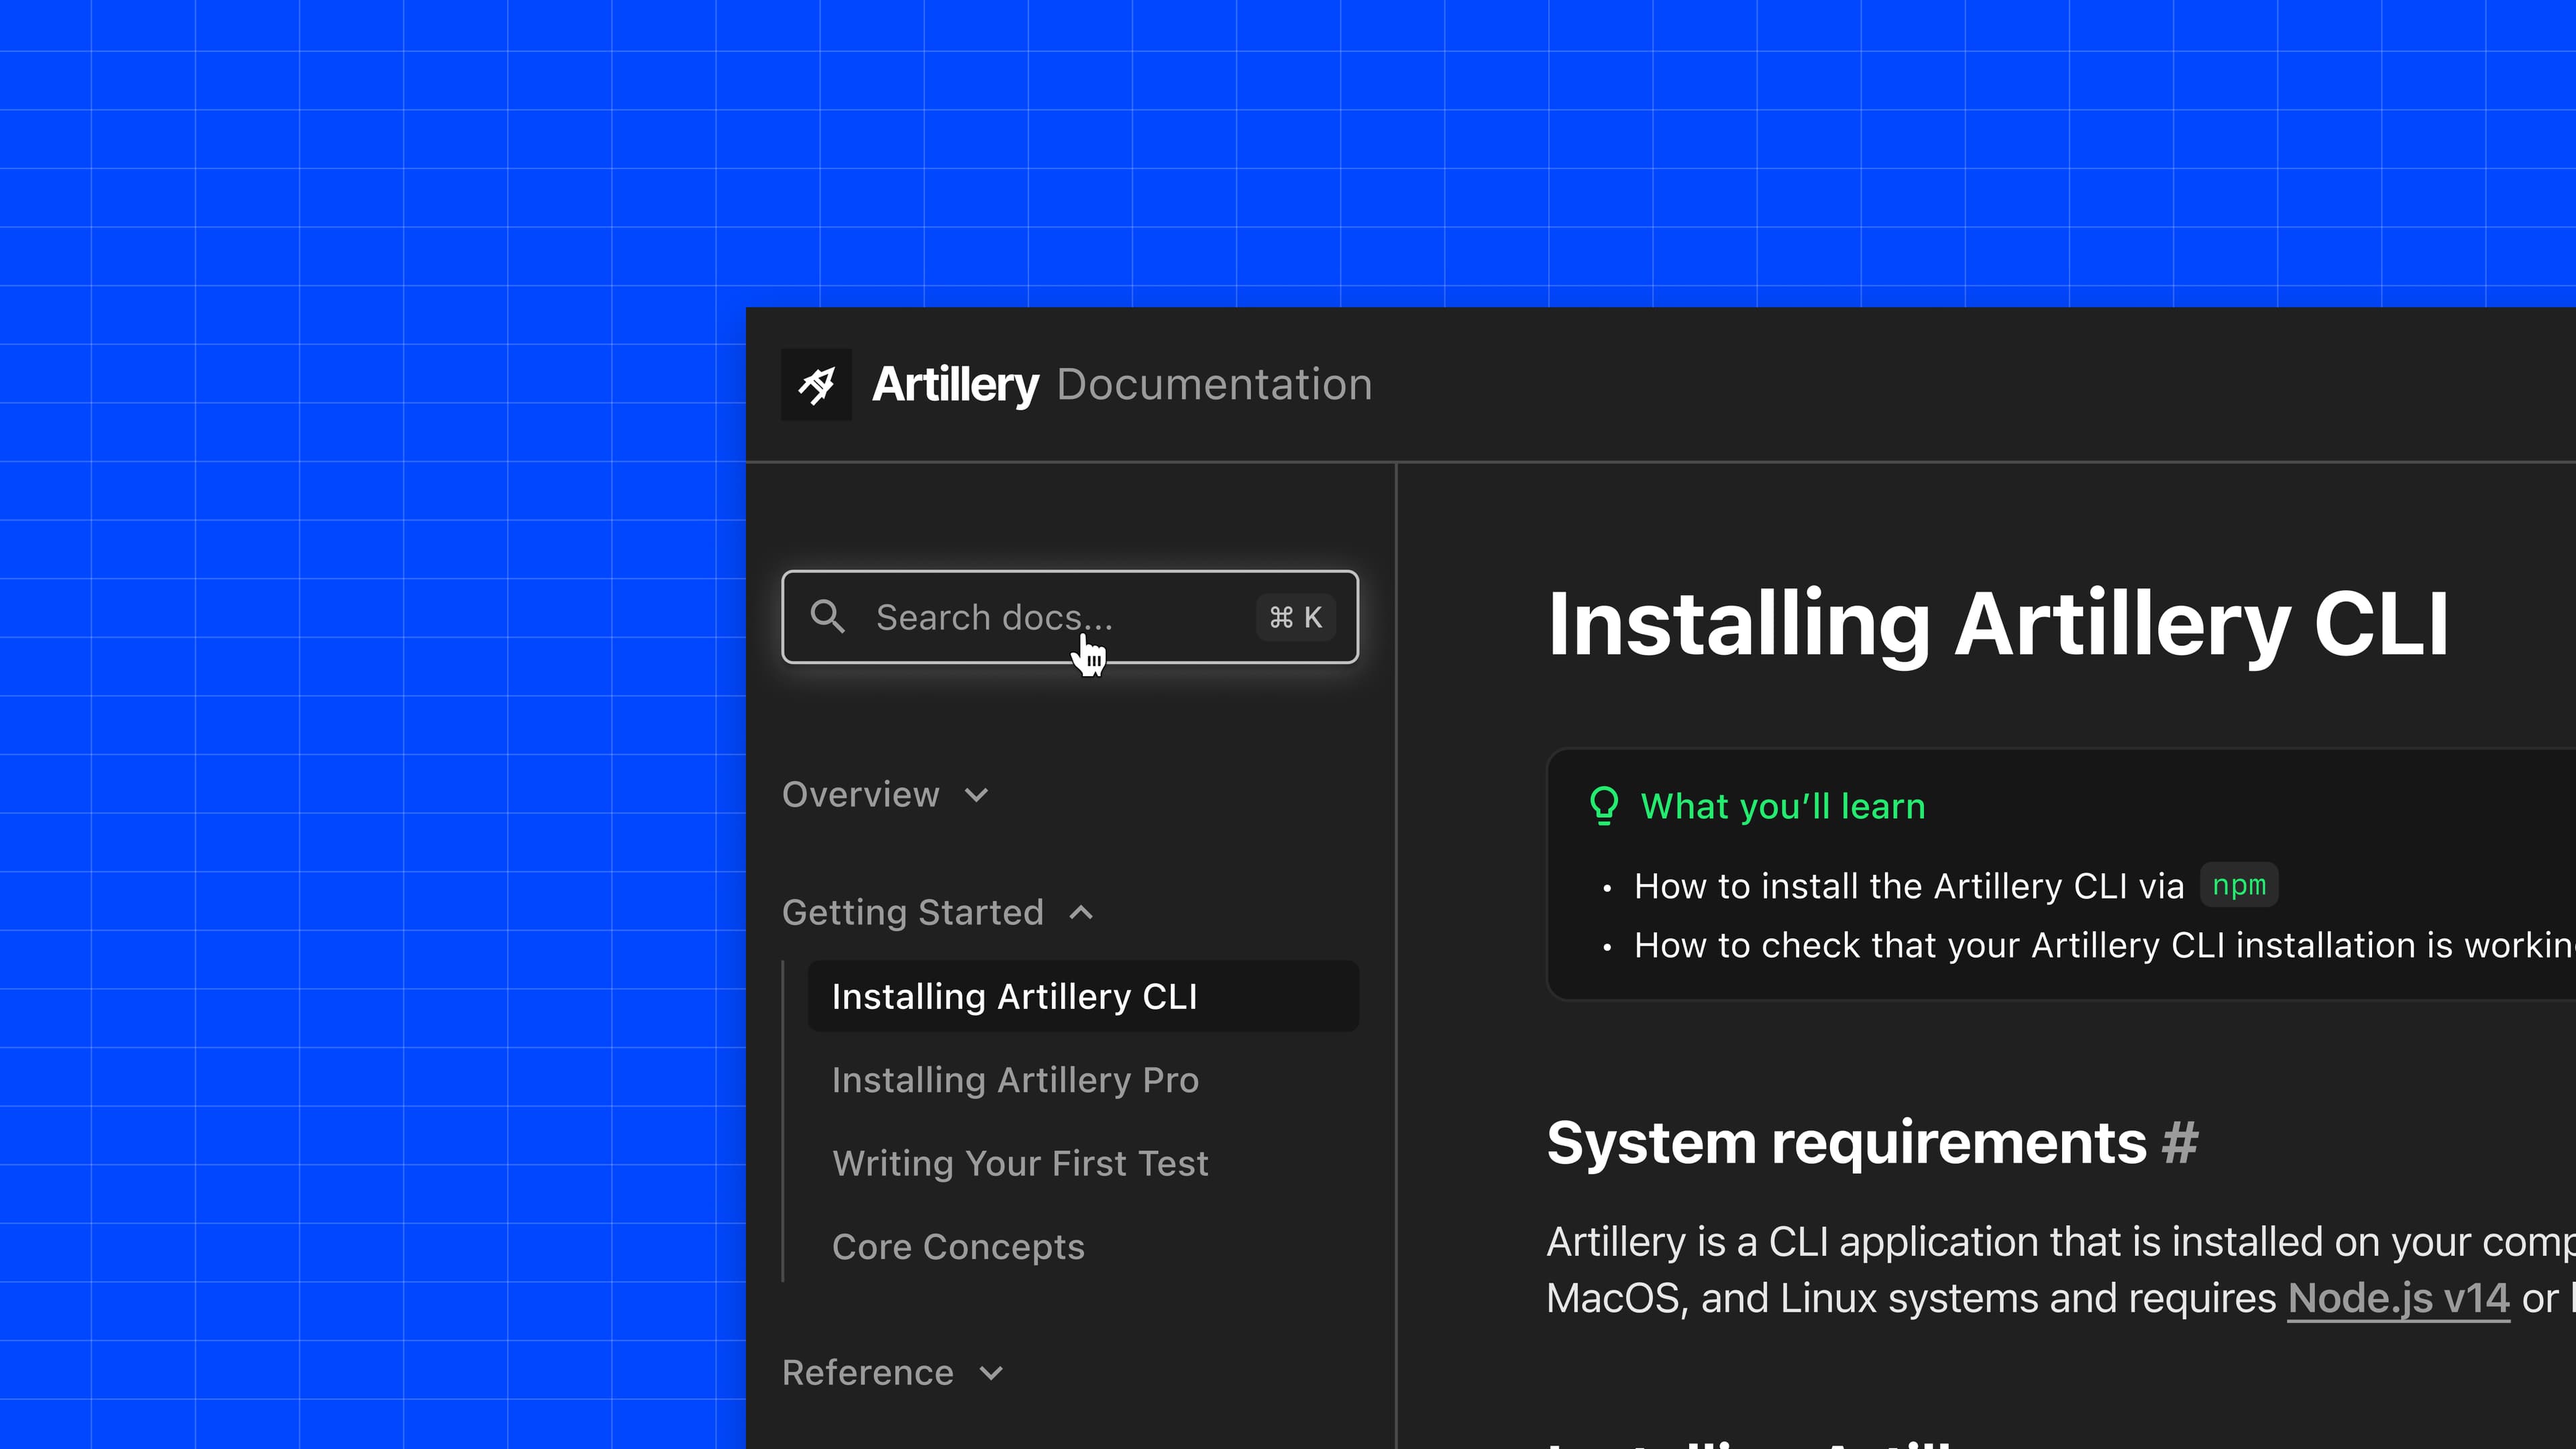
- Documentation search is now available
- A whole lot of polish to improve readability: layout, typography, colors, layout & spacing
- Need to get to the docs quickly? Try
Polish & fixes:
- Add horizontal scrolling to the main load test view when the number of column exceeds display size
- Load test view: clicking on tag in the sidebar will filter for that tag
- Order of charts in the sidebar matches that on the page
- Fix Y-axis overflow in load test list view
- Fix bug with allowing duplicate tag selection
- Fix “Copy JSON” button on load test report view
- Fix for an exception shown when some metrics from a test run are missing
- Fix spacing between tags in load test view
- Fix filter icon colors
- Fix styling of “clear” button in tag filter component
- Fixed issue with saving large test run results produced by long-running (8+ hours) load tests
- Fixed issue with aggregating summary metrics at the end of a test run under certain conditions
- Add to command to set a limit on running time of a test
- Handle Fargate throttling when launching multiple large load tests in parallel
New kubectl plugin! Use to scaffold tests for existing Kube services. Available from
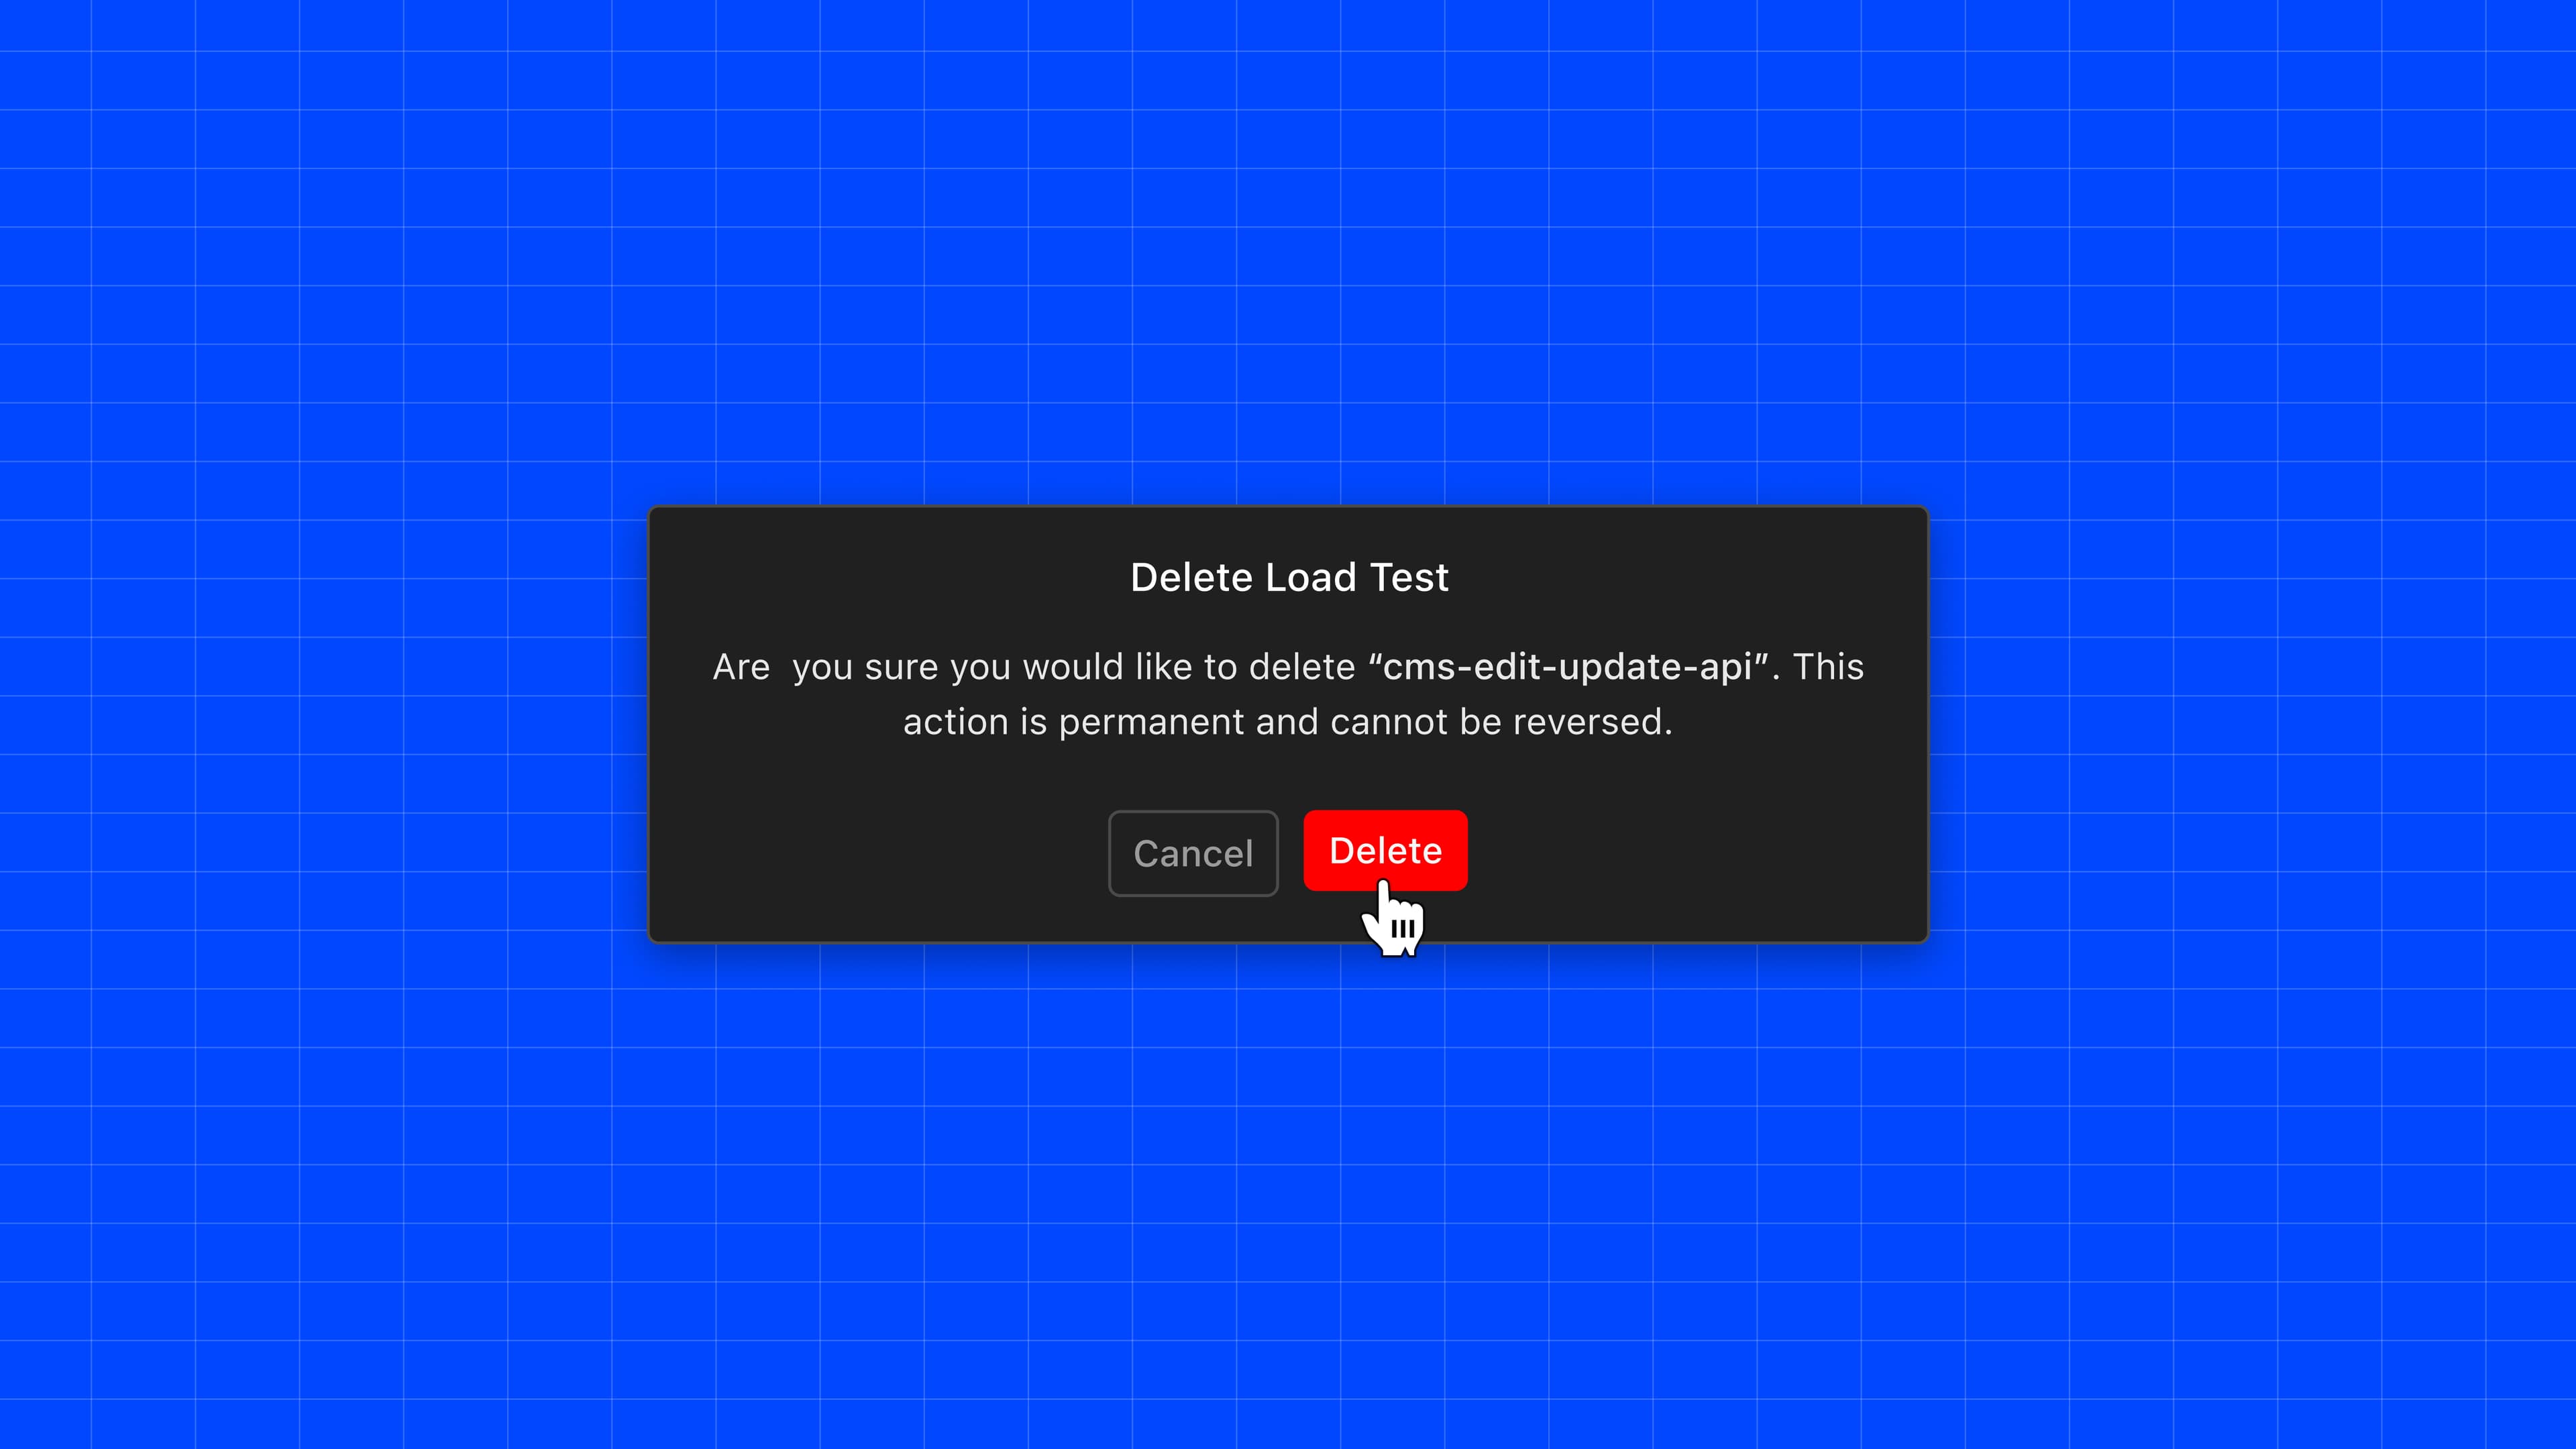
Delete load test results
Sometimes you don’t need to keep a test result around - maybe the run did not complete and you don’t need the report, or perhaps you ran the test in the wrong environment and the results are meaningless. Whatever the reason, you can now delete test results you don’t need.
In case you missed it in the previous changelog, this can be done from the CLI too with the - Add command.
Artillery v2.0.0-13 has been released:
- Fix issue with phase names sometimes not being printed
- Add support for matching multiple headers with the same name in the expectations plugin (see an example )
- The , plugin, and plugin are now bundled with Artillery
(Artillery Pro Dashboard is in early beta with a small number of Artillery Pro customers. If you’d like to join the beta, please let us know via
)
Last week we made a few changes focused on improving querying & filtering, providing more context around test run data, and adding a bit of extra polish.
More powerful filtering
You can now search & filter by:
- tags
- date range
- status
- or a combination of the above
We also improved the tag filtering input and made tag filter query easier to read.
Customize main load test view
You can now customize the columns shown in the main load test view to be able to find what you’re looking for faster.
More test metadata
We’ve exposed more metadata for test runs in the sidebar. You can now see more information for each test run now, such as:
- Full command used to trigger the test run
- CPU and memory configuration for the workers
- Version information for Artillery CLI used to trigger the test
- Names of secrets used by the test run
Progress indicators
Sometimes filtering and searching can take a bit of time, especially for more complex queries. We’ve added loading indicators in a few places to make it clear that the UI is busy doing the thing you asked it to do.
Fixes
- Fixed bug which would cause the view to scroll to the top when viewing Notes
- Fixed “Finished at” time being shown incorrectly for tests which are in progress
- Add command
- returns extra metadata about a test run:
- cliArgs - full CLI args that a test was run with
- secrets - names of secrets passed to the test run
- platformConfig - platform-specific configuration, e.g. CPU and memory config on Fargate/ECS

Welcome to our brand new changelog where we will keep you updated on new releases, features, fixes and improvements in our products.
Searching & Filtering
You can now filter the list of load test results by multiple tags.
You can further refine a tag filter with test status. For example to show all test runs tagged with team:sre and service:checkout-service which did not complete successfully.
Chart navigation
You can now jump straight to a chart for a specific metric from the sidebar.
Zooming and panning
We added support for zooming and panning to metric charts.
Update notifications
When a new release of the dashboard is available, the app will show a notification in the top-right corner, along with a link to the changelog and upgrade instructions.
We have released an early preview of the Artillery Operator for Kubernetes. The goal of the project is to make Kubernetes-specific workflows easier with Artillery. We’d love to hear your feedback, comments, and suggestions.