Load test insights in Artillery Dashboard
We have released a big update to the Artillery Dashboard with a focus on improving the Overview section and our charting engine to let you understand load test results faster.
Load Test Overview
- Show Peak RPS achieved during a load test run
- Display errors (if any) at the top of the screen
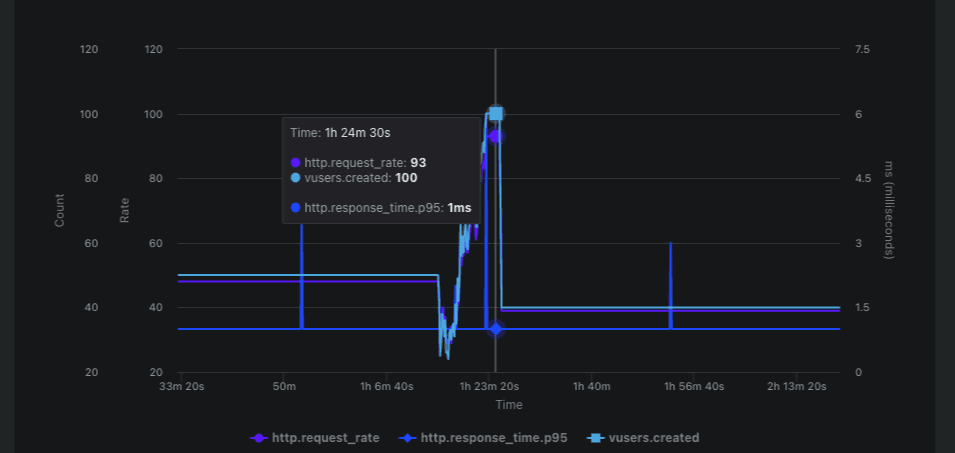
- New “Load Summary” chart to visualize request rate, response time, and VUs created across the test run

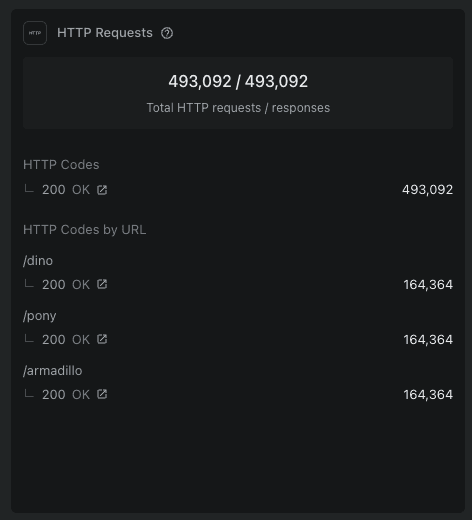
- Show a breakdown of HTTP codes by URL

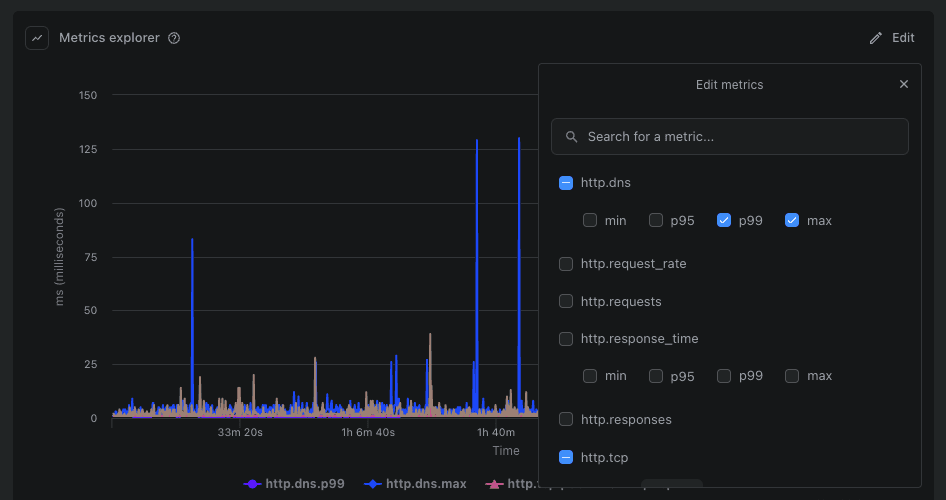
- New “Metric Explorer” widget to let you chart and compare any metric (including custom metrics) generated by the test run

Fixes, Tweaks and Polish
- Layout: tweaks to spacing across the board to increase information density and make more room for what matters. Improved layout of the main test list view and individual test views.
- Charting: ability to combine multiple metrics on one chart
- Charting: show combined tooltips for each point along the time axis
- Fix for sidebar and main area overlapping at some screen sizes
- Fix issue with flash messages disappearing from view
- Improve tag list display in the main list view