Building Artillery’s New Relic and Splunk integrations
This is a guest blog post from @InesNi who has made several contributions to Artillery’s open source projects and has kindly volunteered to write about her experience and to share her knowledge about writing extensions for Artillery.
Artillery offers an array of functionality and features right out of the box. However, its true strength lies in its extensibility,
as it can be customised to suit your specific needs. I’ll be discussing one such customization in this blog post: the ability to create
a custom reporter for the publish-metrics plugin. This plugin enables the dispatching of metrics and events/traces from Artillery
to external monitoring and observability systems, and it allows the creation of reporters for those targets/systems that are
not supported yet.
As part of my transition into a tech career, I embraced open source to cultivate my skills and acquire hands-on experience. I had
already made my initial foray into open source contributions with a few bug fixes and a minor feature addition to Artillery’s code,
and was looking for a slightly larger challenge. I decided on constructing the New Relic reporter that would allow users
to configure the built-in publish-metrics plugin to send metrics from Artillery to New Relic through the New Relic API.
What I did not know at the time is just how much Artillery’s extensibility design had simplified this project for me. Let
me demonstrate how I ended up building two new reporters for the publish-metrics plugin.
Architecture of the publish-metrics plugin
Building a plugin for Artillery is a relatively straightforward process, as can be seen from the available documentation, examples , and this blog post .
There are 2 requirements a plugin must satisfy in order for Artillery to be able to load it properly:
- Be an
npmpackage prefixed withartillery-plugin; - Export a
Pluginclass whose constructor function receives script and events as arguments.
Similarly, building a reporter is just as straightforward because of the way publish-metrics plugin is designed:
- The
Pluginclass forms the foundation of the plugin. It acts as an interface between Artillery and the reporters by looking for targets set in the publish-metrics configuration, and initializing the reporters for those targets. It uses the following arguments for initialization:config– The user configuration for that specific reporter;script– The entire test script;events– An EventEmitter that plugins can use to subscribe to particular events or to emit their custom metrics (scriptandeventsbeing the same arguments thatPluginreceives from Artillery);- It also defines a
cleanup()function that will allow any active reporters to run any necessary tasks before Artillery terminates.
- Each reporter is an individual unit that exists in a distinct file, and is fundamentally a unique class explicitly crafted to dispatch data to a particular observability solution - one of the supported targets of the
publish-metricsplugin. Each reporter is required to export a function that initializes it, which is then imported in the main index.js of the package where it hooks into thePluginclass.
As you can see, reporters are essentially plugins with slightly different, but just as simple basic structure requirements, which we will go through in detail as we are building the New Relic reporter.
Now that we understand the interplay of components, we are ready to start.
Building the New Relic Reporter
New Relic is an Application Performance Monitoring platfom that provides insights into the performance and user interactions of
your applications. Having a publish-metrics reporter for this target will help New Relic users include the Artillery test metrics in their
APM along with their other application data.
Our objective here is also to create a repeatable template for building a reporter, that can be used to create reporters in the future:
- Create the reporter skeleton - satisfying main requirements for reporter to be properly loaded and connected to Artillery
- Setting up user configuration
- Format data for sending to target
- Send data
- Add debugging
- Use the reporter
Create the reporter skeleton
Initial file structure
Within the artillery-plugin-publish-metrics package create a separate file, and in it create a JavaScript class that will hold
all of the logic. This class should:
- Be named
<Target>Reporter. In our case that will beNewRelicReporter; - Have a constructor function with 3 parameters as we mentioned above:
config,eventsandscript; - Have a
cleanupmethod with thedone()callback.
In the same file, create and export the create<Target>Reporter function that instantiates the class.
'use strict';

class NewRelicReporter {
  constructor(config, events, script) {
    this.config = config;
  }
  cleanup(done) {
    return done();
  }
}

function createNewRelicReporter(config, events, script) {
  return new NewRelicReporter(config, events, script);
}

module.exports = {
  createNewRelicReporter,
};
Connecting the plugin
Next, let’s hook our Reporter into the Plugin by importing the create<Target>Reporter function in index.js:
const { createNewRelicReporter } = require('./lib/newrelic');Then, let’s embed it into the Plugin class logic:
function Plugin(script, events) {
  …
  this.reporters = [];
  (script.config.plugins['publish-metrics'] || []).forEach((config) => {
    if (
      config.type === 'datadog' ||
      config.type === 'statsd' ||
      config.type === 'influxdb-statsd'
    ) {
      this.reporters.push(createDatadogReporter(config, events, script));
    …

    } else if (config.type === 'newrelic') {
      this.reporters.push(createNewRelicReporter(config, events, script));
    }
    …
  });
  return this;
}
Subscribing to data
We get data by subscribing to one of the events depending on what our reporter is sending.
Our NewRelicReporter will subscribe to the stats event, which is emitted following each reporting phase throughout a test run, either every 10 seconds or at the conclusion of a load phase. The event supplies us with the metrics particular to that period.
This approach capitalises on Artillery’s pre-existing ‘batching’ system to format and dispatch metrics to New Relic at regular intervals. By transmitting data batches approximately every 10 seconds, we can avoid exceeding the requests per minute or the payload size limit associated with the New Relic Metric API. Once more, Artillery simplifies this process for us.
events.on('stats', async (stats) => {
  console.log(stats);
  // here is where we:
  // - grab the data
  // - format the data for sending
  // - send the data to New Relic
});
With this our New Relic reporter skeleton is finished and plugged into Artillery.
In order for Artillery to load it it needs to be set in the publish-metrics config by setting type to newrelic.
 config:
    target: 'http://my_test_website'
    plugins:
      publish-metrics:
        - type: newrelic
Choosing how to send data
Typically, I would use an official Node.js SDK to transmit metrics from Artillery. However, given that New Relic’s Node.js Telemetry SDK has reached its end of life (EOL), it became necessary to interact with its Metric API directly.
The API works by sending a POST request to New Relic’s HTTP endpoint with a JSON payload containing the metric data. In order for the Metric API to receive the data the HTTP request must be configured in a certain way specified here .
Configuration for the reporter
From the Metric API requirements we see that we must have a licenseKey and region of the account we want to send the data to, but let’s also add some extra optional configuration options for the user:
prefix– a prefix for metric names created by Artillery; defaults to artillery;attributes— a list of ‘name:value’ strings to use as tags for all metrics sent during a test;excluded— a list of metric names which should not be sent to New Relic. Defaults to an empty list, i.e. all metrics are sent to New Relic;includeOnly— a list of specific metrics to send to New Relic. No other metrics will be sent. Defaults to an empty list, i.e. all metrics are sent to New Relic.
See an example of the config in this test script below. We will use this test script later to test our reporter when it is finished:
config:
  target: 'http://my_test_website'
  plugins:
    publish-metrics:
      - type: newrelic
        licenseKey: '{{ $processEnvironment.NEW_RELIC_LICENSE_KEY }}'
        region: 'eu'
        prefix: 'hello.from.newrelic.reporter.'
        attributes:
          - 'type:soak-test'
          - 'service:my-service'
        includeOnly:
          - 'http.requests'

  phases:
    - duration: 30
      arrivalRate: 10
scenarios:
  - flow:
      - get:
          url: '/'
Formatting data for sending to target
Depending on which target you’re sending to, you’ll need to convert the data from Artillery’s structure to the target’s structure - in the case of New Relic, we need to adhere to this specific structure in order to interact with its API.
To abstract this away, I created the following method that creates the necessary payload to send to the Metrics API. The common key holds properties that remain consistent across all metrics within the payload, so we’ll utilise it for:
timestampandinterval: they are derived from the same reporting period, so this will be common to all metrics;attributes(tags): they are defined by the user of the plugin, so these will also be the same across all metrics.
createRequestBody(timestamp, interval, attributeList, metrics) {
    const parsedAttributes = {};
    if (attributeList.length > 0) {
      for (const item of attributeList) {
        const attribute = item.split(':');
        parsedAttributes[attribute[0]] = attribute[1];
      }
    }

    const body = [
      {
        common: {
          timestamp,
          'interval.ms': interval,
          attributes: parsedAttributes
        },
        metrics
      }
    ];

    return body;
  }
Next let’s set the timestamp and interval . The stats object has the firstMetricAt and lastMetricAt properties that we use to get the interval:
events.on('stats', async (stats) => {
  const timestamp = Date.now();
  const interval = Number(stats.lastMetricAt) - Number(stats.firstMetricAt);
});
Looking at Artillery’s stats object below (which we obtained by console.logging) we can see that the properties we are interested in are rates, counters and summaries:
{
  counters: {
    'vusers.created_by_name.0': 2,
    'vusers.created': 2,
    'http.requests': 2,
    'http.codes.200': 2,
    'http.responses': 2,
    'vusers.failed': 0,
    'vusers.completed': 2
  },
  histograms: {
   …
  },
  rates: { 'http.request_rate': 2 },
  firstMetricAt: 1686262872713,
  lastMetricAt: 1686262872775,
  …
  summaries: {
    'http.response_time': {
      min: 1,
      max: 20,
      count: 2,
      p50: 1,
      median: 1,
      p75: 1,
      p90: 1,
      p95: 1,
      p99: 1,
      p999: 1
    },
    'vusers.session_length': {
      min: 11.3,
      max: 35.9,
      count: 2,
      p50: 11.4,
      median: 11.4,
      p75: 11.4,
      p90: 11.4,
      p95: 11.4,
      p99: 11.4,
      p999: 11.4
    }
  }
}
Now that we know the structure of the stats object, let’s format our data and create the request body.
formatCountersForNewRelic(counters, config) {
 const statMetrics = [];
 for (const [name, value] of Object.entries(counters || {})) {
   if (config.excluded.includes(name)) {
     continue;
   }
   if (config.includeOnly.length > 0 && !config.includeOnly.includes(name)) {
     continue;
   }
   statMetrics.push({
     name: `${config.prefix}${name}`,
     type: 'count',
     value
   });
 }
 return statMetrics;
}
And finally, we can hook this up to the stats event:
events.on('stats', async (stats) => {
 const timestamp = Date.now();
 const interval =
   Number(stats.lastCounterAt) - Number(stats.firstCounterAt);

 const rates = this.formatRatesForNewRelic(stats.rates, this.config);
 const counters = this.formatCountersForNewRelic(
   stats.counters,
   this.config
 );
 const summaries = this.formatSummariesForNewRelic(
   stats.summaries,
   this.config
 );

 const reqBody = this.createRequestBody(
   timestamp,
   interval,
   this.config.attributes,
   [...rates, ...counters, ...summaries]
 );
Sending metrics to New Relic
Having prepared all the necessary data, we’re now ready to dispatch our metrics to New Relic. We simply implement a method to send the API call to New Relic (using the http library got), and implement appropriate error handling and logging for when the response from the New Relic API is unexpected.
async sendStats(url, licenseKey, body) {
 this.pendingRequests += 1;
 const headers = {
   'Content-Type': 'application/json; charset=UTF-8',
   'Api-Key': licenseKey
 };
 const options = {
   headers,
   json: body
 };

 debug('sending metrics to New Relic');
 try {
   const res = await got.post(url, options);
   if (res.statusCode !== 202) {
     debug(`Status Code: ${res.statusCode}, ${res.statusMessage}`);
   }
 } catch (err) {
   debug(err);
 }

 this.pendingRequests -= 1;
}
Occasionally, metrics will still be in the process of being sent after Artillery has finished its test, due to the asynchronous nature of its architecture. To account for pending requests, we implement the following code within the clean up method prior to Artillery’s exit:
async waitingForRequest() {
 while (this.pendingRequests > 0) {
   debug('Waiting for pending request ...');
   await new Promise((resolve) => setTimeout(resolve, 500));
 }

 debug('Pending requests done');
 return true;
}
Add debugging
Last step before testing is to incorporate debugging into our reporter as seen in the code above. Artillery uses the debug package to provide
debug information for each of its subcomponents, which may be controlled via the DEBUG environment variable.
- Import it with
const debug = require('debug')('plugin:publish-metrics:newrelic') making sure to namespace the reporter/plugin accordingly.- Use
debug('message')where necessary in the code. - To see debug logs, set
DEBUG=plugin:publish-metrics:newrelic(or another appropriate namespace) when running Artillery. For example:
DEBUG=plugin:publish-metrics:newrelic artillery run my-script.yamlAll done
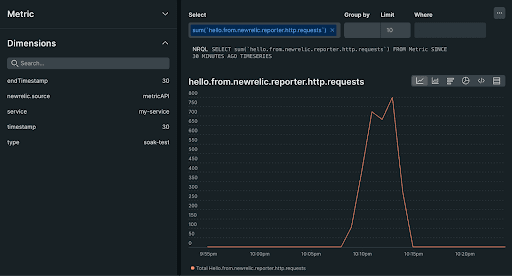
Our New Relic Reporter is done and ready to be used!
Running the example test script from above we can confirm that our reporter works by observing the metrics in New Relic:
Creating Splunk reporter
Once the New Relic reporter was built, I had a template for building the basis of any reporter, so I had to build another one, just for fun! I picked Splunk , and following the template it was built in no time! See the finished reporter here ›
Summary
Through this blog post, we’ve taken a detailed exploration into the construction of a custom reporter for the publish-metrics plugin, specifically with a focus on New Relic. This reporter exemplifies the extensibility of Artillery, demonstrating how its inherent design simplifies the process of creating tailored solutions to meet specific needs.
The development journey we’ve traced provides a fundamental blueprint for building the base of any reporter. This blueprint, however, is a stepping stone, as unique considerations or requirements may arise with different target systems. For anyone interested in all the other ways you can extend and customise Artillery, check out the docs.
On a personal note, I had so much fun with this project and it has been an enriching learning journey. I hope that this blog post inspires further contributions in the Artillery ecosystem, fostering continued growth and adaptability of the tool.
Happy load testing everyone! 🚀